Using the macro to trade sectors
Analyzing the historical track record of key composite leading indicators provides an understanding of where we are in the current cycle, and contextualizes the expected performance of various areas of the economy.
Aug 20, 2025While inexact at times, the study of macroeconomic cycles can be an invaluable part of the investing process. By understanding which part of the cycle we’re in, as well as the interplay between this information and market gyrations, investors can make more informed decisions on allocation and exposure. For instance, having an elevated level of risk exposure to defensive sectors like utilities and healthcare makes little sense when the economy has begun to expand after a recovery. As another example, demand for commodities (especially copper) will usually decline during periods of economic contraction.
At its most basic level, which investment professionals well understand, there are four phases of the economic cycle:
- The first is expansion – which is when an economy is growing as private sector demand remains strong. Households are spending money, and businesses are expanding operations to meet that demand.
- The second is the peak – when the economy is operating at, or above, potential. During this phase, employment is generally close to its full level while inflation is likely to rise.
- The third is contraction – which is when the economy slows down as households cut spending and businesses curb production. A particularly severe version of a contraction is called a recession.
- The final is the trough – which is the lowest point of the cycle. During this phase, the economy starts to recover as demand starts to improve from weak levels.
These phases are often influenced by several factors including: government-level policy making (both fiscal and monetary), the level of interest and exchange rates. All of which work to affect the supply/demand balance for different markets. There are several different ways to calibrate where we are in the cycle, but in our experience, the most reliable predictor has been the OECD series of composite leading indicators (CLI).1
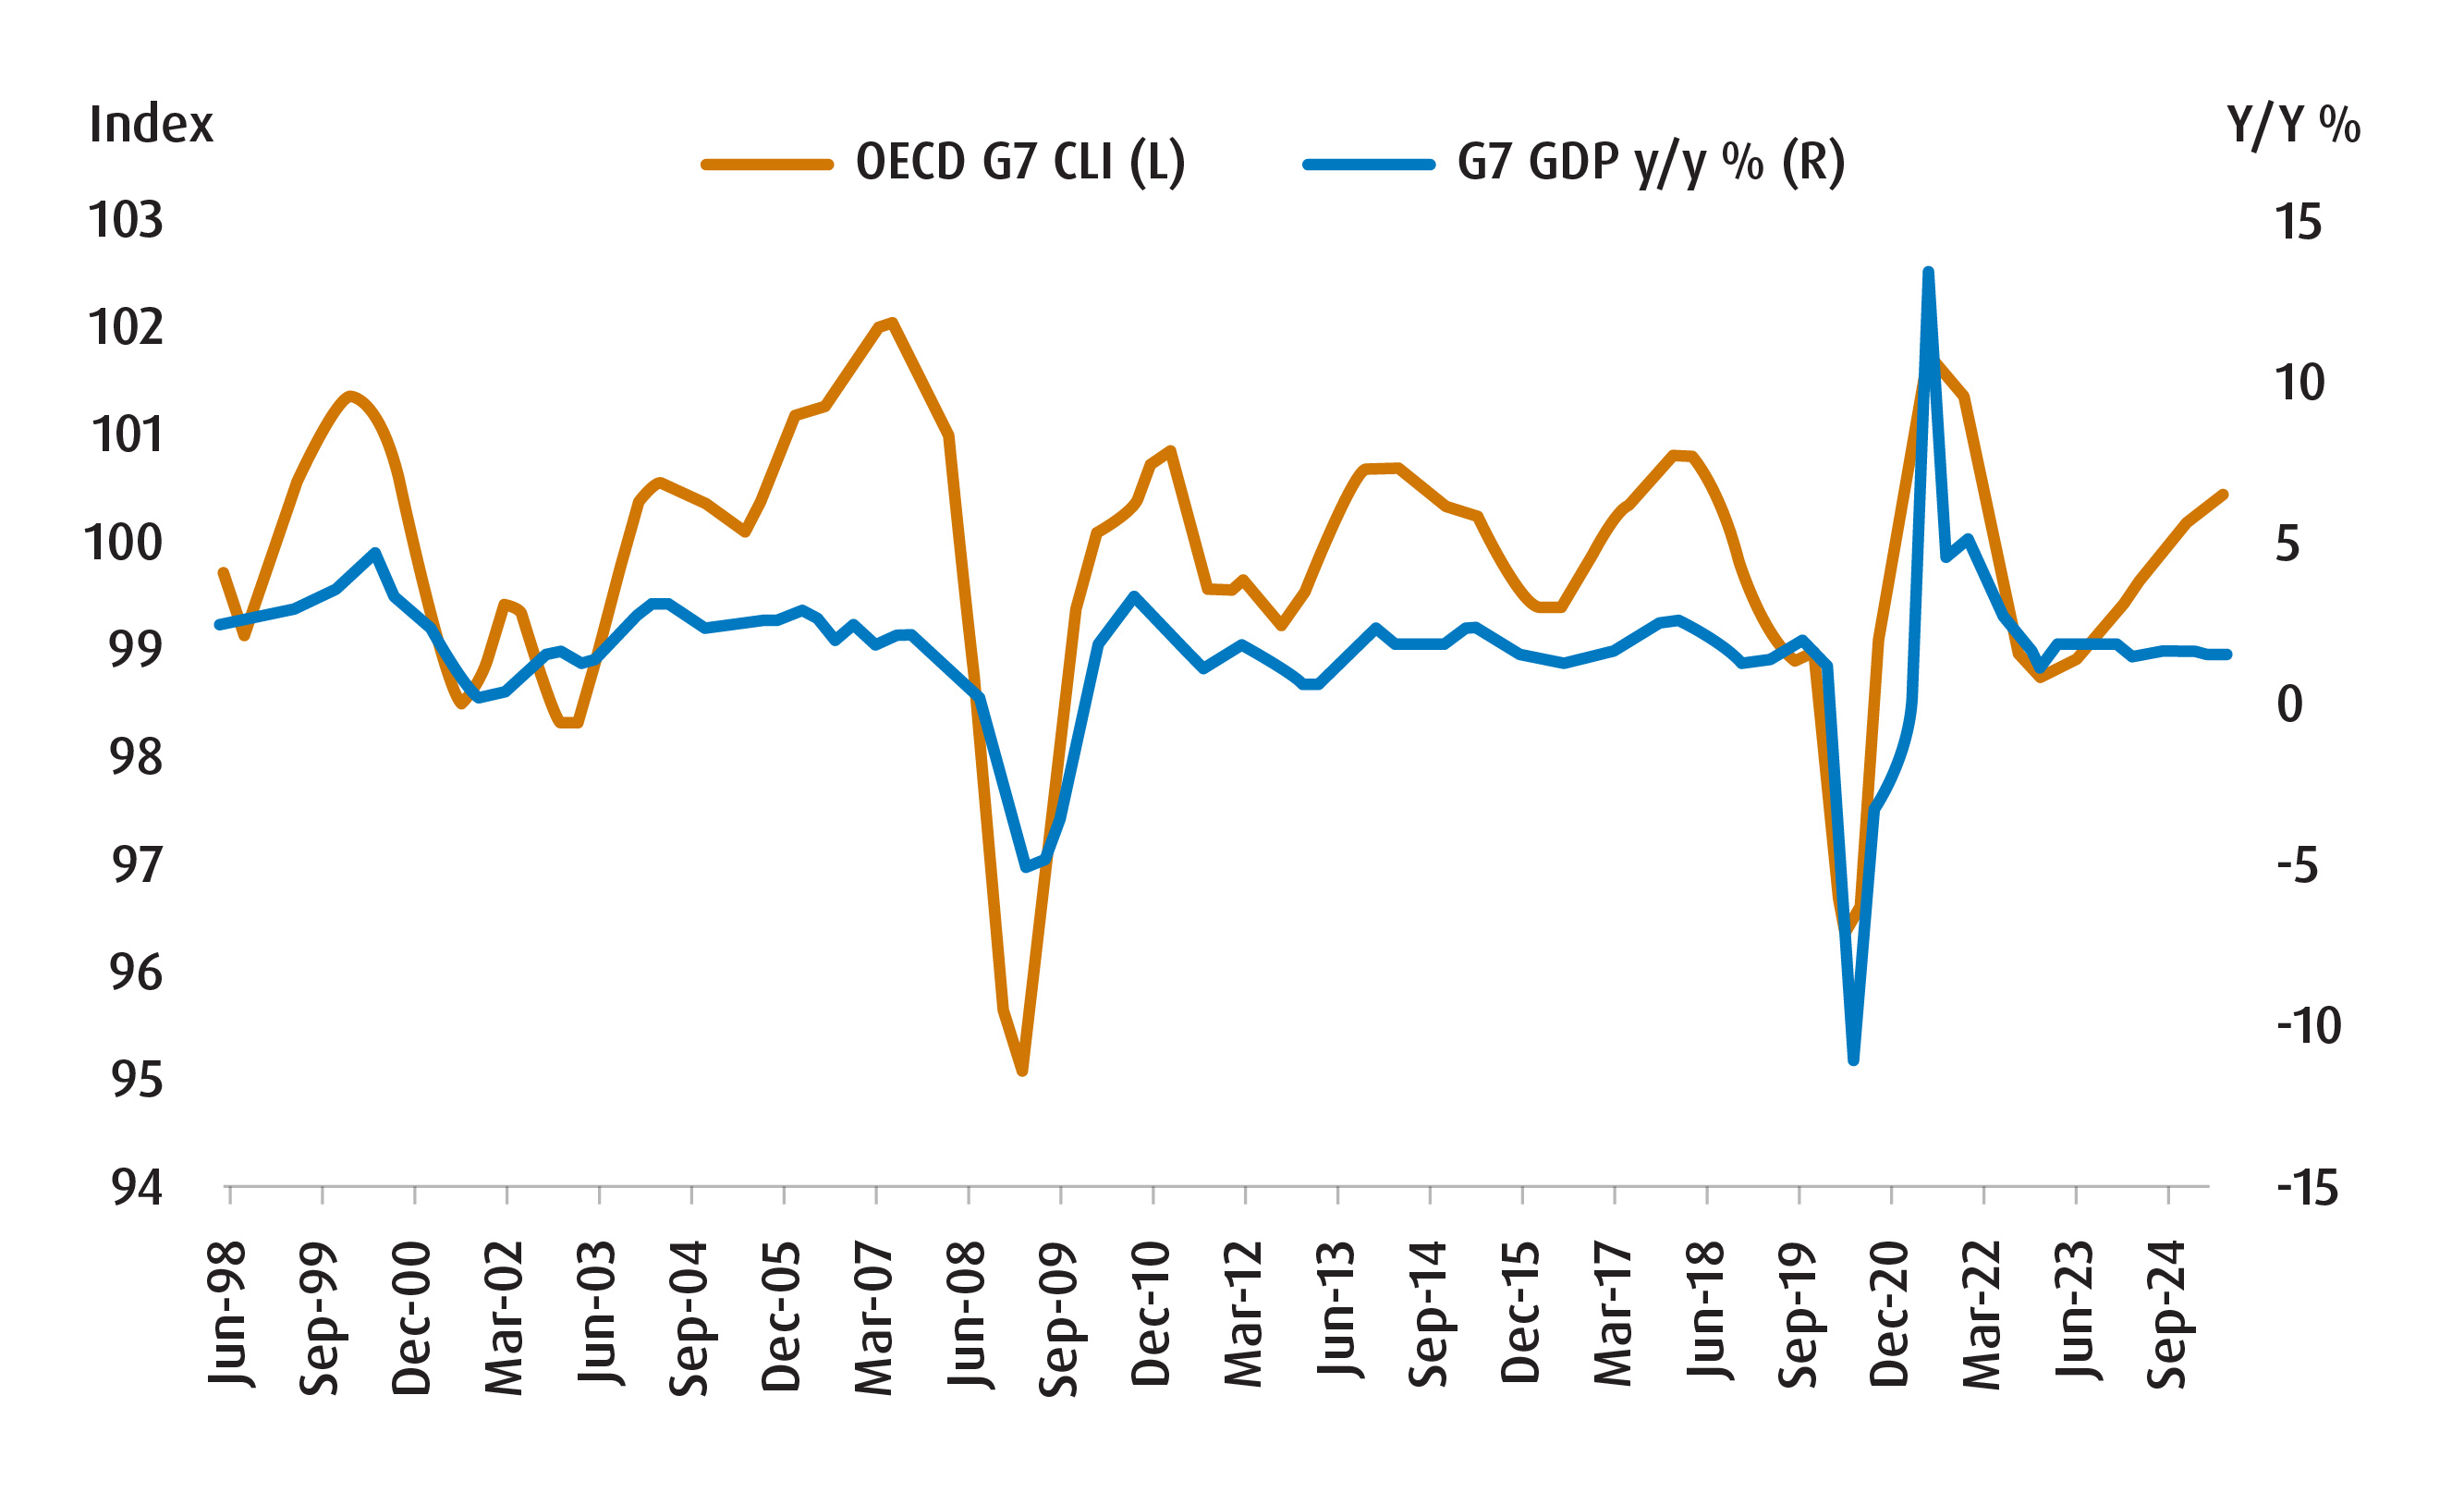
Chart 1 shows the ‘amplitude adjusted’ CLI for the aggregate G7 economies. This series is calibrated to focus on the shifts in the output gap (or the fluctuations of economic activity relative to long-term potential) to provide early warning signals for changes in the business cycle. There are two things to understand from the chart: first, that the upward trend in the series implies that we are in the expansionary phase of the cycle. Second, the time spent in this phase has been considerably long.
Chart 1 – The OECD Amplitude Adjusted Composite Leading Indicator for G7 economies

In order to understand that second point, we turn to Table 1, which shows the past seven expansions and the length of time spent in them. The current expansion for G7 economies has lasted 32 months, which is the longest of all prior expansions and well above the average of 20.4 months. When we take that observation with the fact that i) monetary policy is moderately restrictive in the United States, and ii) trade barriers between the developed countries are much higher now relative to before, our sense is that developed market economies are now in the midst of a transition from ‘expansion’ to ‘peak’.
Table 1 – The past seven expansionary phases for G7 economies and length of time
January 2023 - |
32 months |
May 2020 – June 2021 |
13 months |
June 2016 – February 2018 |
20 months |
September 2012 – January 2014 |
16 months |
February 2009 – February 2011 |
24 months |
May 2005 – May 2007 |
24 months |
February 2003 – May 2004 |
14 months |
Average |
20.43 months |
Source: OECD, BMO Global Asset Management, as of June 2025.
During the ‘peak’, investors should start to position their portfolios for a slowdown. What does that mean?
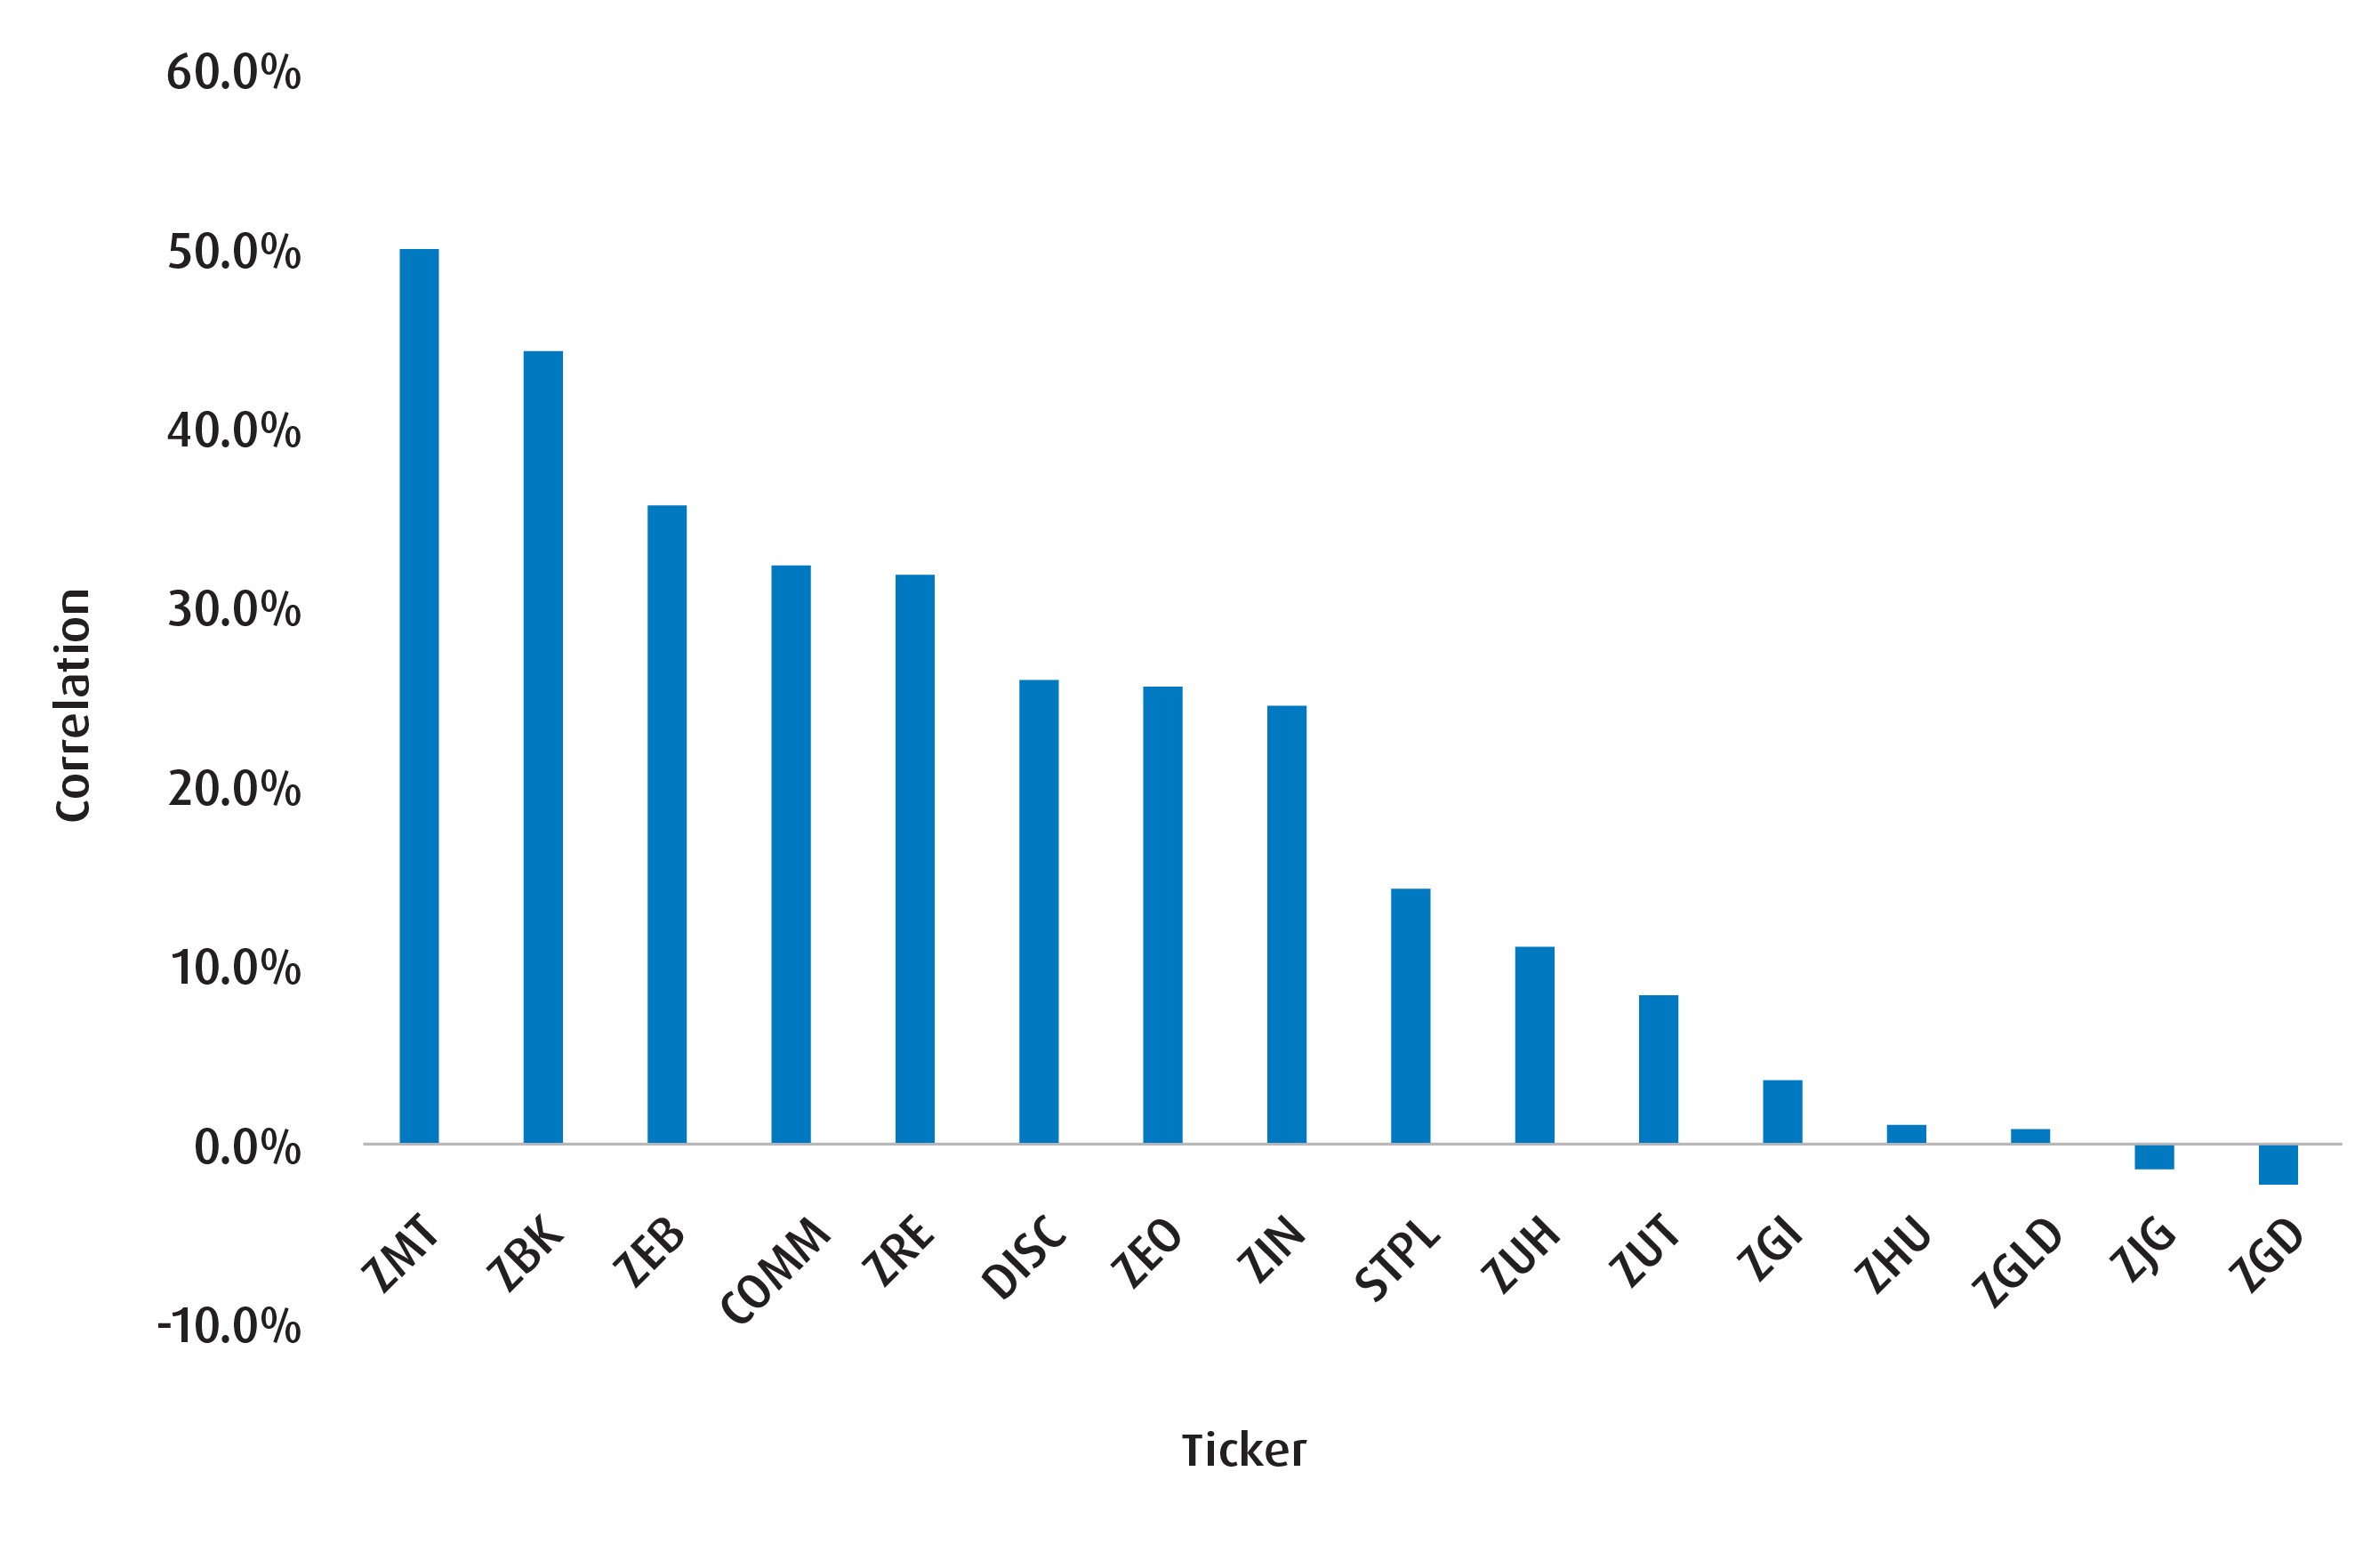
Chart 2 shows the correlation for sector ETFs in BMO Global Asset Management’s product suite against the OECD’s CLI for the G7 economies. These correlations go back ten years – which means they’ll capture a few of the business cycles which will help us contextualize how each of the ETFs move with them. Unsurprisingly, the strongest positive correlation is with ZMT – which is something we’d expect given the procyclical nature of base metals. But given our view that the macro backdrop is pivoting towards defensiveness, this would not be the product we’d look at.
Chart 2 – Correlation of sectors with OECD G7 CLI

Instead, we’d expect to see further upside with ETFs that are far less correlated to the CLI. That would mean ZGD, ZJG (gold miners) as well as ZGLD, ZHU and ZGI. Indeed, the diversification benefits of ‘haven’ sectors and commodities will come in handy if the developed world begins to transition into a more challenging backdrop.
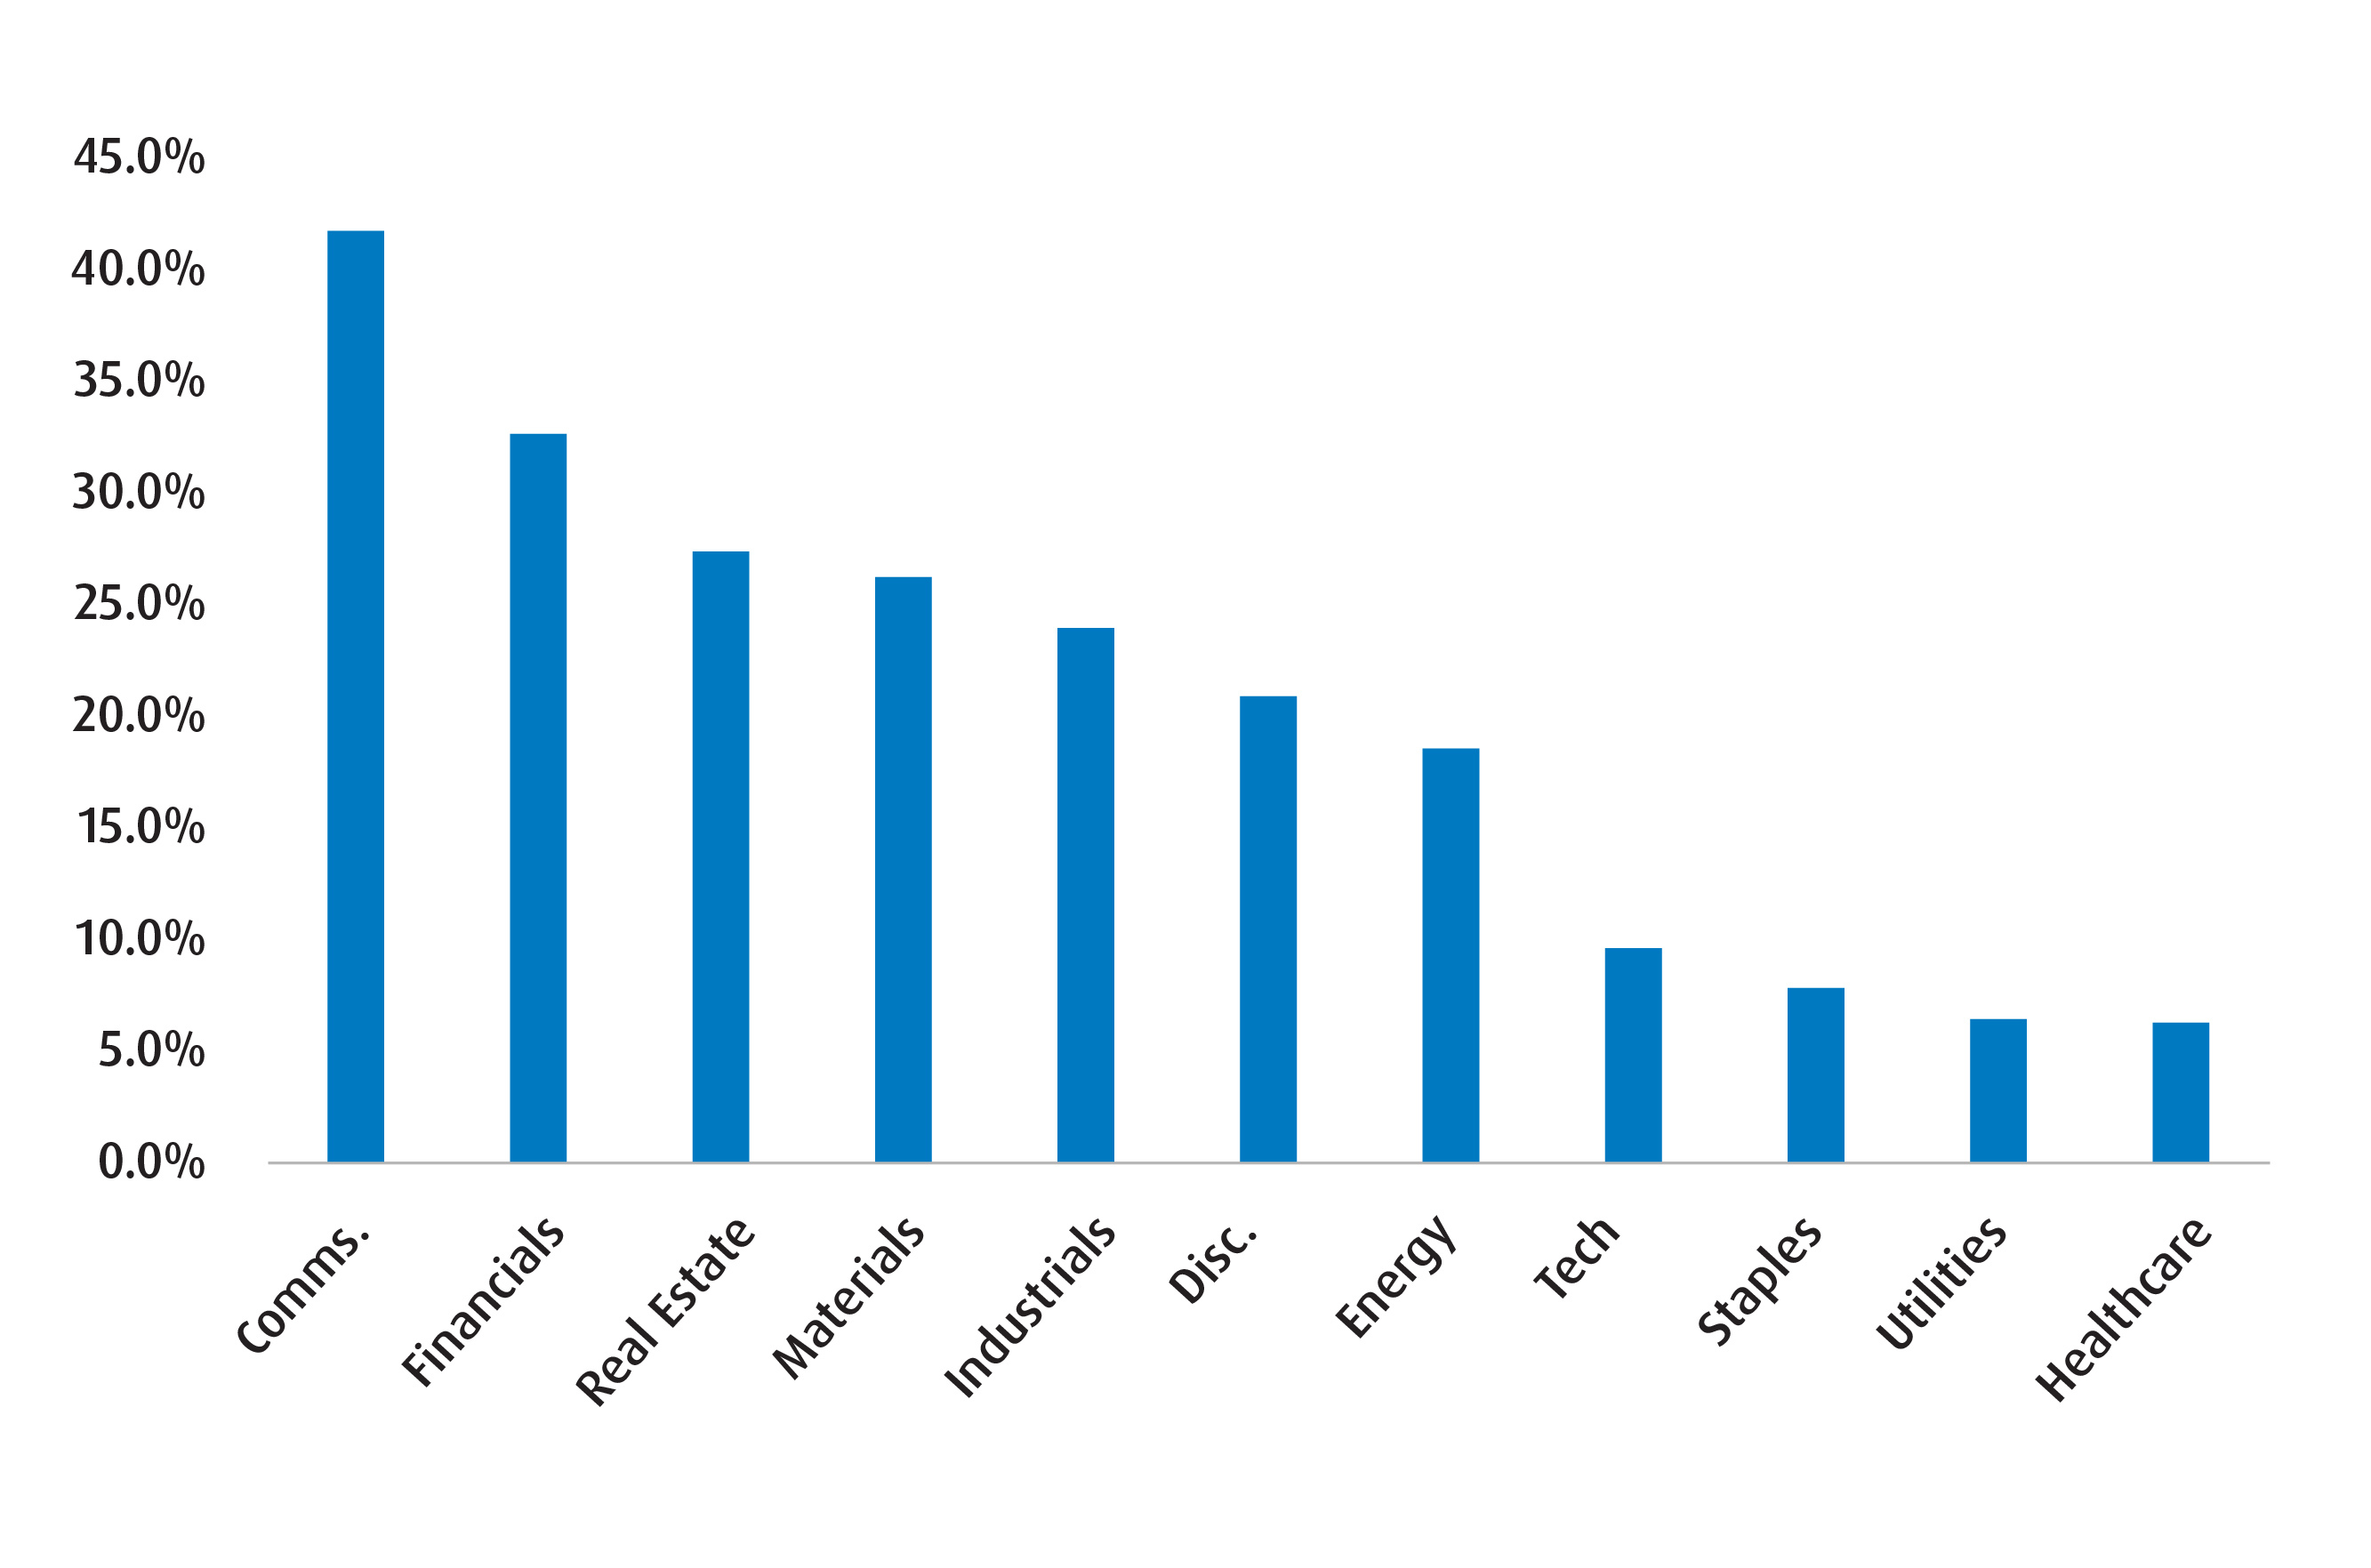
In the U.S., we perform the same analysis, but substitute the G7 CLI for the U.S. version. Chart 3 displays the results – which indicates that Staples, Utilities, Healthcare and Tech are the sectors best placed going forward.
Chart 3 – Correlation of U.S. sectors with OECD U.S. CLI

The new BMO SPDR Select Sector Index ETFs are efficient allocations for direct exposures to those areas, with ZXLP (Consumer Staples), ZXLU (Utilities), ZXLV (Healthcare) and ZXLK (Technology) serving as entry points. Additionally, each are also listed in hedged formats (.F).
Please contact your BMO institutional sales partner for additional market insights. For more market insights and commentary from BMO ETFs Strategist Bipan Rai, please visit and bookmark Basis Points.
1Composite leading indicator (CLI), OECD.
Performance (%)
Year-to-date |
1-month |
3-month |
6-month |
1-year |
3-year |
5-year |
10-year |
Since inception |
||
BMO Equal Weight Global Base Metals Hedged to CAD Index ETF |
14.97 |
9.73 |
21.64 |
14.97 |
13.97 |
20.58 |
18.63 |
5.26 |
0.74 |
|
BMO Equal Weight Global Gold Index ETF |
52.88 |
4.15 |
13.83 |
52.88 |
74.63 |
38.80 |
15.00 |
15.64 |
6.20 |
|
BMO Junior Gold Index ETF |
47.09 |
3.43 |
13.72 |
47.09 |
71.98 |
35.02 |
11.88 |
14.53 |
2.81 |
|
BMO Gold Bullion ETF |
19.23 |
-0.49 |
-0.20 |
19.23 |
40.06 |
- |
- |
- |
42.96 |
|
BMO Equal Weight US Health Care Index ETF |
-8.09 |
1.60 |
-5.60 |
-8.09 |
-5.86 |
2.46 |
2.05 |
- |
4.93 |
|
BMO Global Infrastructure Index ETF |
1.88 |
-0.42 |
-4.65 |
1.88 |
22.05 |
9.44 |
10.38 |
7.93 |
11.43 |
|
BMO SPDR Consumer Staples Select Sector Index ETF |
Returns are not available as there is less than one year’s performance data. |
|||||||||
BMO SPDR Utilities Select Sector Index ETF |
||||||||||
BMO SPDR Health Care Select Sector Index ETF |
||||||||||
BMO SPDR Technology Select Sector Index ETF |
||||||||||
Bloomberg, as of June 30, 2025. Inception date for ZMT = October 20, 2009, ZGD = November 14, 2012, ZJG = January 19, 2010, ZGLD = March 4, 2024, ZHU = February 12, 2019, ZGI = January 19, 2010, ZXLP, ZXLU, ZXLV, ZXLK = February 3, 2025.
Disclaimers
For Advisor and Institutional Use.
Any statement that necessarily depends on future events may be a forward-looking statement. Forward-looking statements are not guarantees of performance. They involve risks, uncertainties and assumptions. Although such statements are based on assumptions that are believed to be reasonable, there can be no assurance that actual results will not differ materially from expectations. Investors are cautioned not to rely unduly on any forward-looking statements. In connection with any forward-looking statements, investors should carefully consider the areas of risk described in the most recent simplified prospectus.
This is for information purposes only. The information contained herein is not, and should not be construed as investment, tax or legal advice to any party. Particular investments and/or trading strategies should be evaluated relative to the individual’s investment objectives and professional advice should be obtained with respect to any circumstance.
The viewpoints expressed by the author represents their assessment of the markets at the time of publication. Those views are subject to change without notice at any time. The information provided herein does not constitute a solicitation of an offer to buy, or an offer to sell securities nor should the information be relied upon as investment advice. Past performance is no guarantee of future results. This communication is intended for informational purposes only.
The Select Sector SPDR Trust consists of eleven separate investment portfolios (each a “Select Sector SPDR ETF” or an “ETF” and collectively the “Select Sector SPDR ETFs” or the “ETFs”). Each Select Sector SPDR ETF is an “index fund” that invests in a particular sector or group of industries represented by a specified Select Sector Index. The companies included in each Select Sector Index are selected on the basis of general industry classification from a universe of companies defined by the S&P 500®. The investment objective of each ETF is to provide investment results that, before expenses, correspond generally to the price and yield performance of publicly traded equity securities of companies in a particular sector or group of industries, as represented by a specified market sector index.
The Index is a product of S&P Dow Jones Indices LLC or its affiliates (“SPDJI”), and has been licensed for use by the Manager. S&P®, S&P 500®, US 500, The 500, iBoxx®, iTraxx® and CDX® are trademarks of S&P Global, Inc. or its affiliates (“S&P”) and Dow Jones® is a registered trademark of Dow Jones Trademark Holdings LLC (“Dow Jones”), and these trademarks have been licensed for use by SPDJI and sublicensed for certain purposes by the Manager. The ETF is not sponsored, endorsed, sold or promoted by SPDJI, Dow Jones, S&P, their respective affiliates, and none of such parties make any representation regarding the advisability of investing in such product(s) nor do they have any liability for any errors, omissions, or interruptions of the Index.
The S&P 500 Index is an unmanaged index of 500 common stocks that is generally considered representative of the U.S. stock market. The index is heavily weighted toward stocks with large market capitalizations and represents approximately two-thirds of the total market value of all domestic common stocks.
The S&P 500 Index figures do not reflect any fees, expenses or taxes. An investor should consider investment objectives, risks, fees and expenses before investing.
You cannot invest directly in an index.
Commissions, management fees and expenses all may be associated with investments in exchange-traded funds. Please read the ETF Facts or prospectus of the BMO ETFs before investing. The indicated rates of return are the historical annual compounded total returns including changes in unit value and reinvestment of all dividends or distributions and do not take into account sales, redemption, distribution or optional charges or income taxes payable by any unitholder that would have reduced returns. Exchange-traded funds are not guaranteed, their values change frequently and past performance may not be repeated.
For a summary of the risks of an investment in the BMO ETFs, please see the specific risks set out in the prospectus. BMO ETFs trade like stocks, fluctuate in market value and may trade at a discount to their net asset value, which may increase the risk of loss. Distributions are not guaranteed and are subject to change and/or elimination.
BMO ETFs are managed by BMO Asset Management Inc., which is an investment fund manager and a portfolio manager, and a separate legal entity from Bank of Montreal.
BMO Global Asset Management is a brand name under which BMO Asset Management Inc. and BMO Investments Inc. operate.
“BMO (M-bar roundel symbol)” is a registered trademark of Bank of Montreal, used under licence.