Why This AI Bubble Won’t Pop Just Yet


- There is an important and meaningful difference between the current AI capex boom and the Tech bubble from 25 years ago. That being that the current AI spending boom is largely funded by internal cash flows as opposed to external (debt) financing.
- However, we do know that commitments to AI capex are increasing. As these commitments increase, it will be harder for today’s generation of tech firms to continue to finance them from their current operating cash flows – meaning more debt financed spending.
- For now, we’re going to continue to lean into the AI capex cycle. We’re still expecting another quarter or two of strong growth here while favourable tax treatments (courtesy of theOne Big Beautiful Bill Act) should continue to provide a strong tailwind.
Funds in focus
- BMO MSCI USA High Quality Index ETF (Ticker: ZUQ)
- BMO Covered Call Technology ETF (Ticker: ZWT)
- BMO SPDR Technology Select Sector Index ETF (Ticker: ZXLK)
There are a lot of parallels being drawn between the current AI boom and the Tech bubble at the turn of the century. The concern appears to be with the degree by which both the markets and the U.S. economy are reliant on AI-related capital expenditures. Indeed, if the outcome for this AI boom is the same as the Tech bubble, then conventional wisdom would be that we are likely to see a pronounced shock when the AI“bubble” finally does burst.
However, there is an important and meaningful difference between the current AI capex boom and the Tech bubble from 25 years ago.
For the latter, the top tech firms were investing heavily in infrastructure (mostly fibre-optic networks, servers, software and IT systems), but most of that capital expenditure was speculative in nature. A lot of the firms didn’t have the earnings to support the large-scale spending – which meant relying heavily on equity (IPOs) and debt financing to fuel capex. What this meant was that when the Tech bubble did burst, overcapacity in infrastructure led to massive write-downs of assets. But you can’t write down debt on the liability side of the balance sheet, which meant that creditors were left holding the bag and the path to systemic risks was wide open.
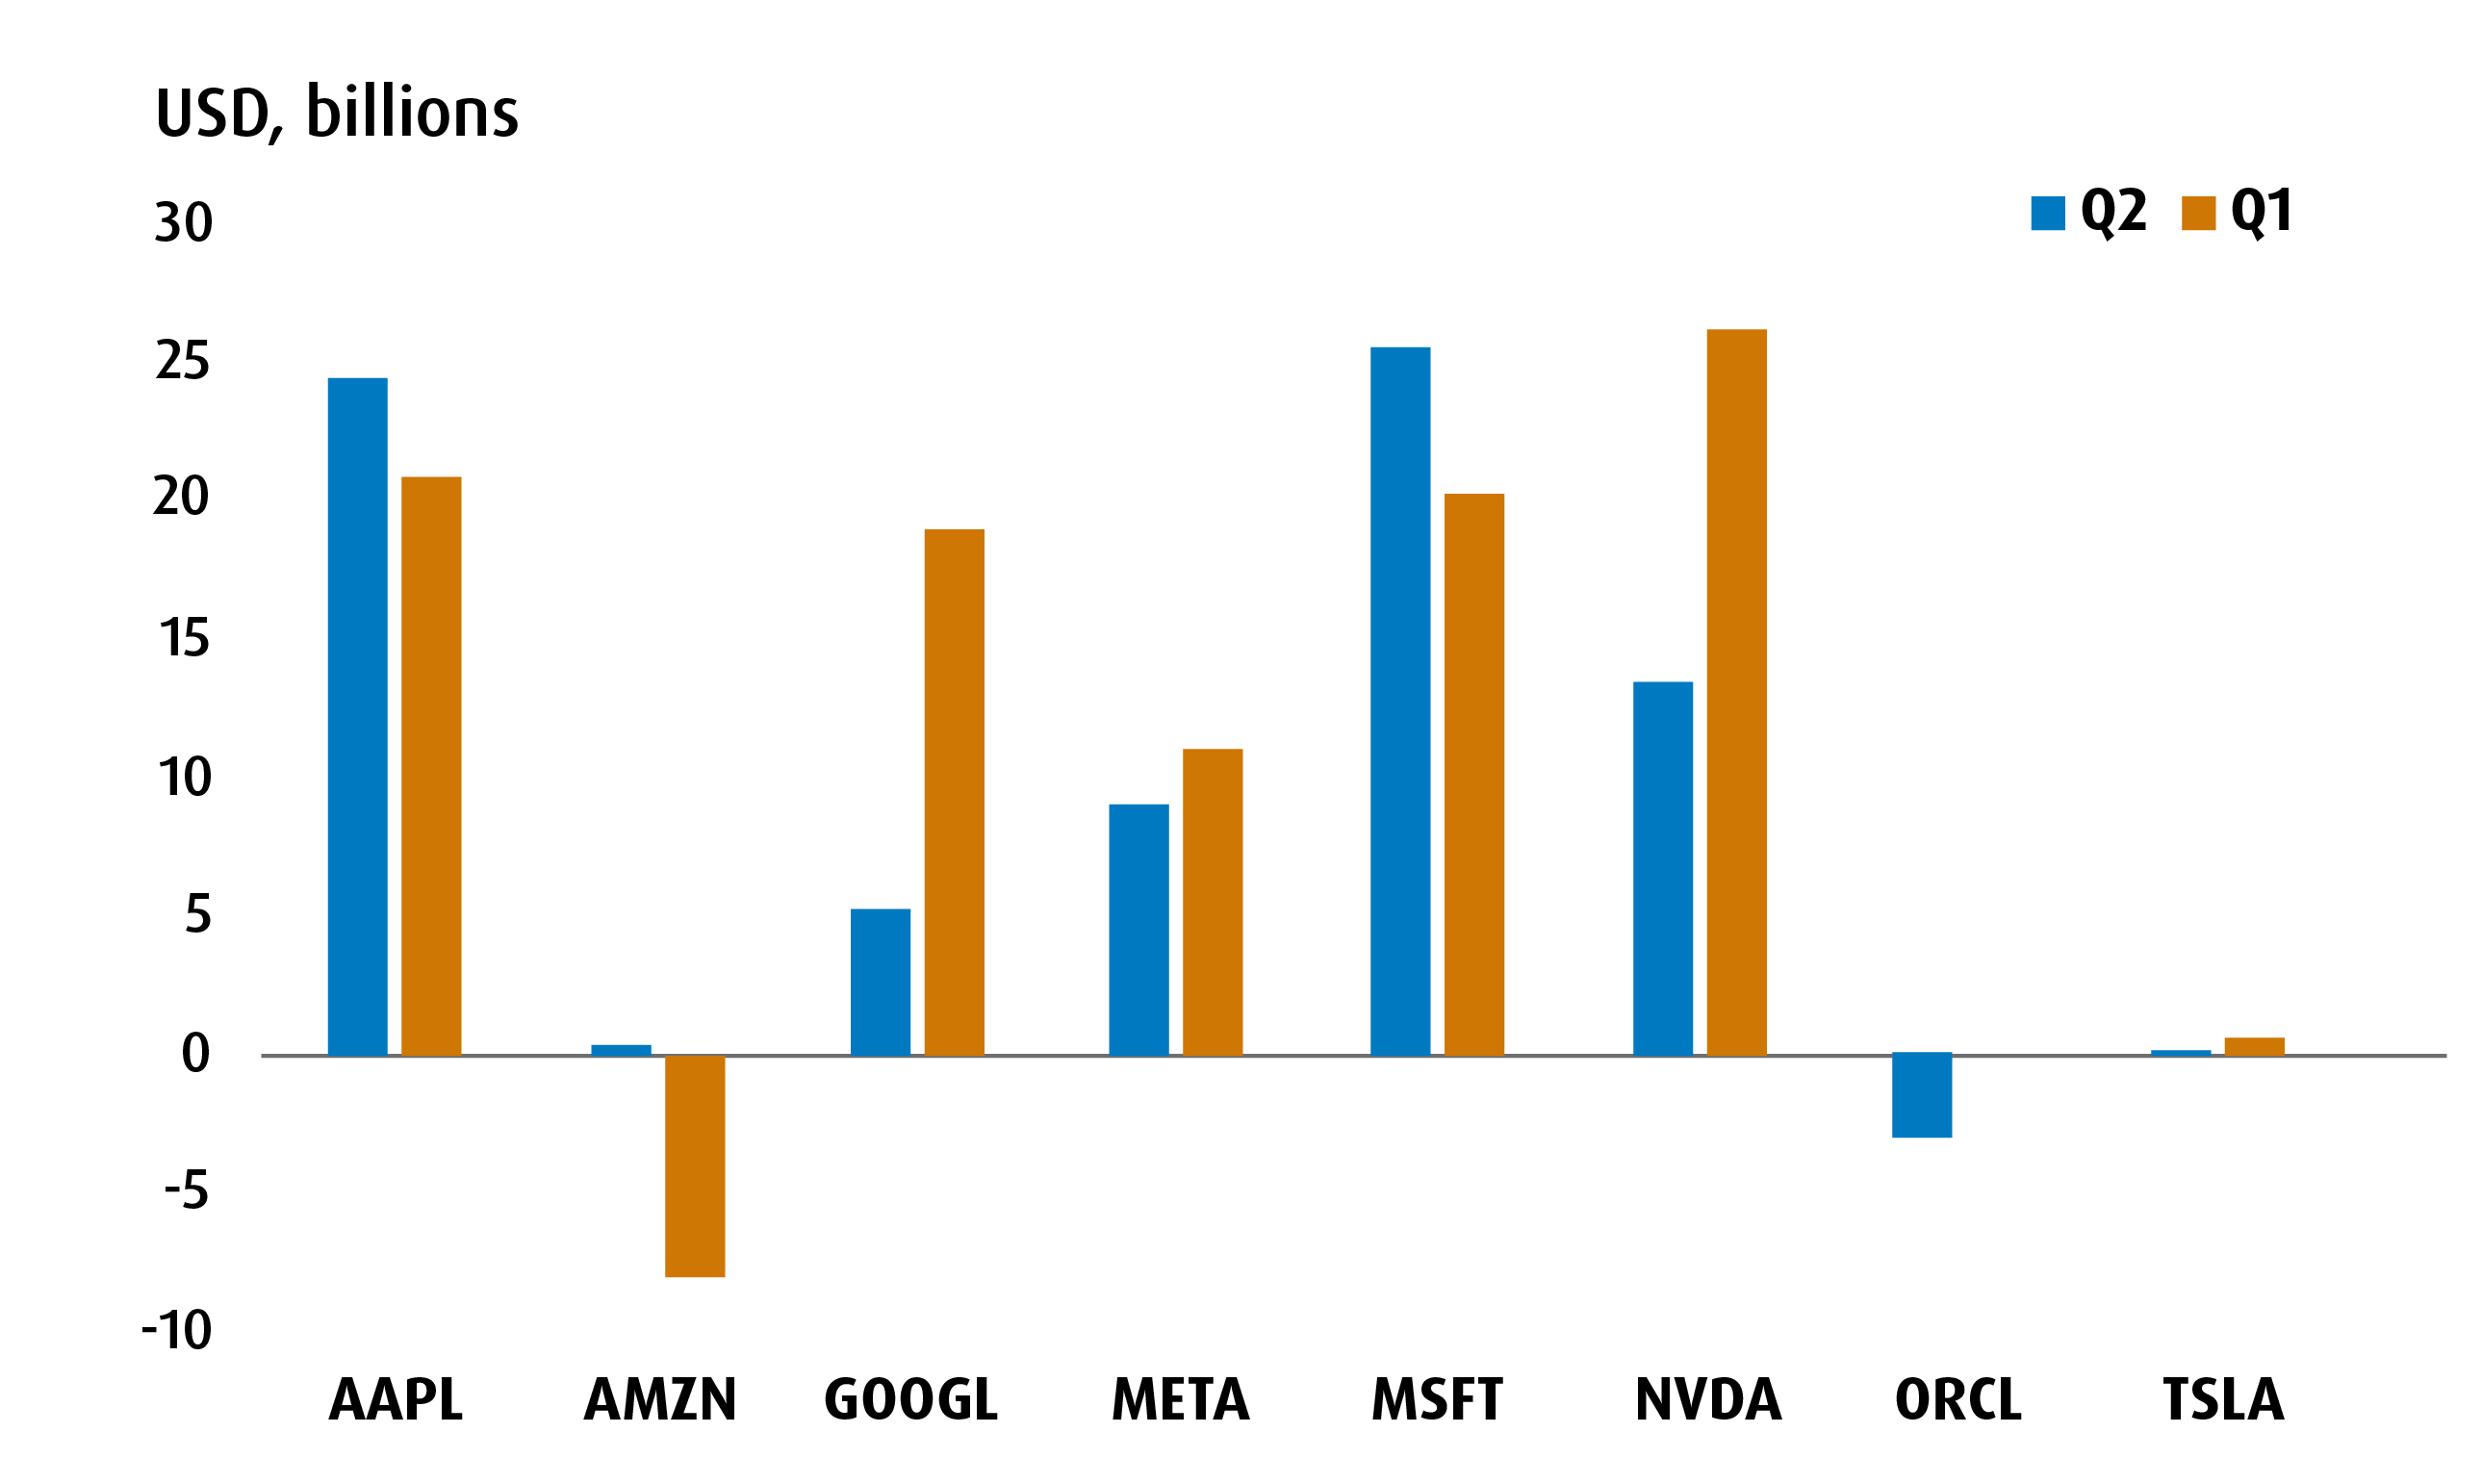
Fast forward to today, and it does feel like the current generation of tech firms have understood the lessons from the past. For example, the Mag 7 and Oracle are estimated to have spent over US$180bln on AI-related capex in H1 of this year – with total spending expected to reach over $300bln in 2025. Despite that, the free cash flow for the big spenders (which is cash flow from operations minus capex) was positive – suggesting that much of the spending has been funded by internal operations instead of external financing. This is good news (see Chart 1).
Chart 1 – Free cash flow for the Mag 7 + Oracle, H1 2025
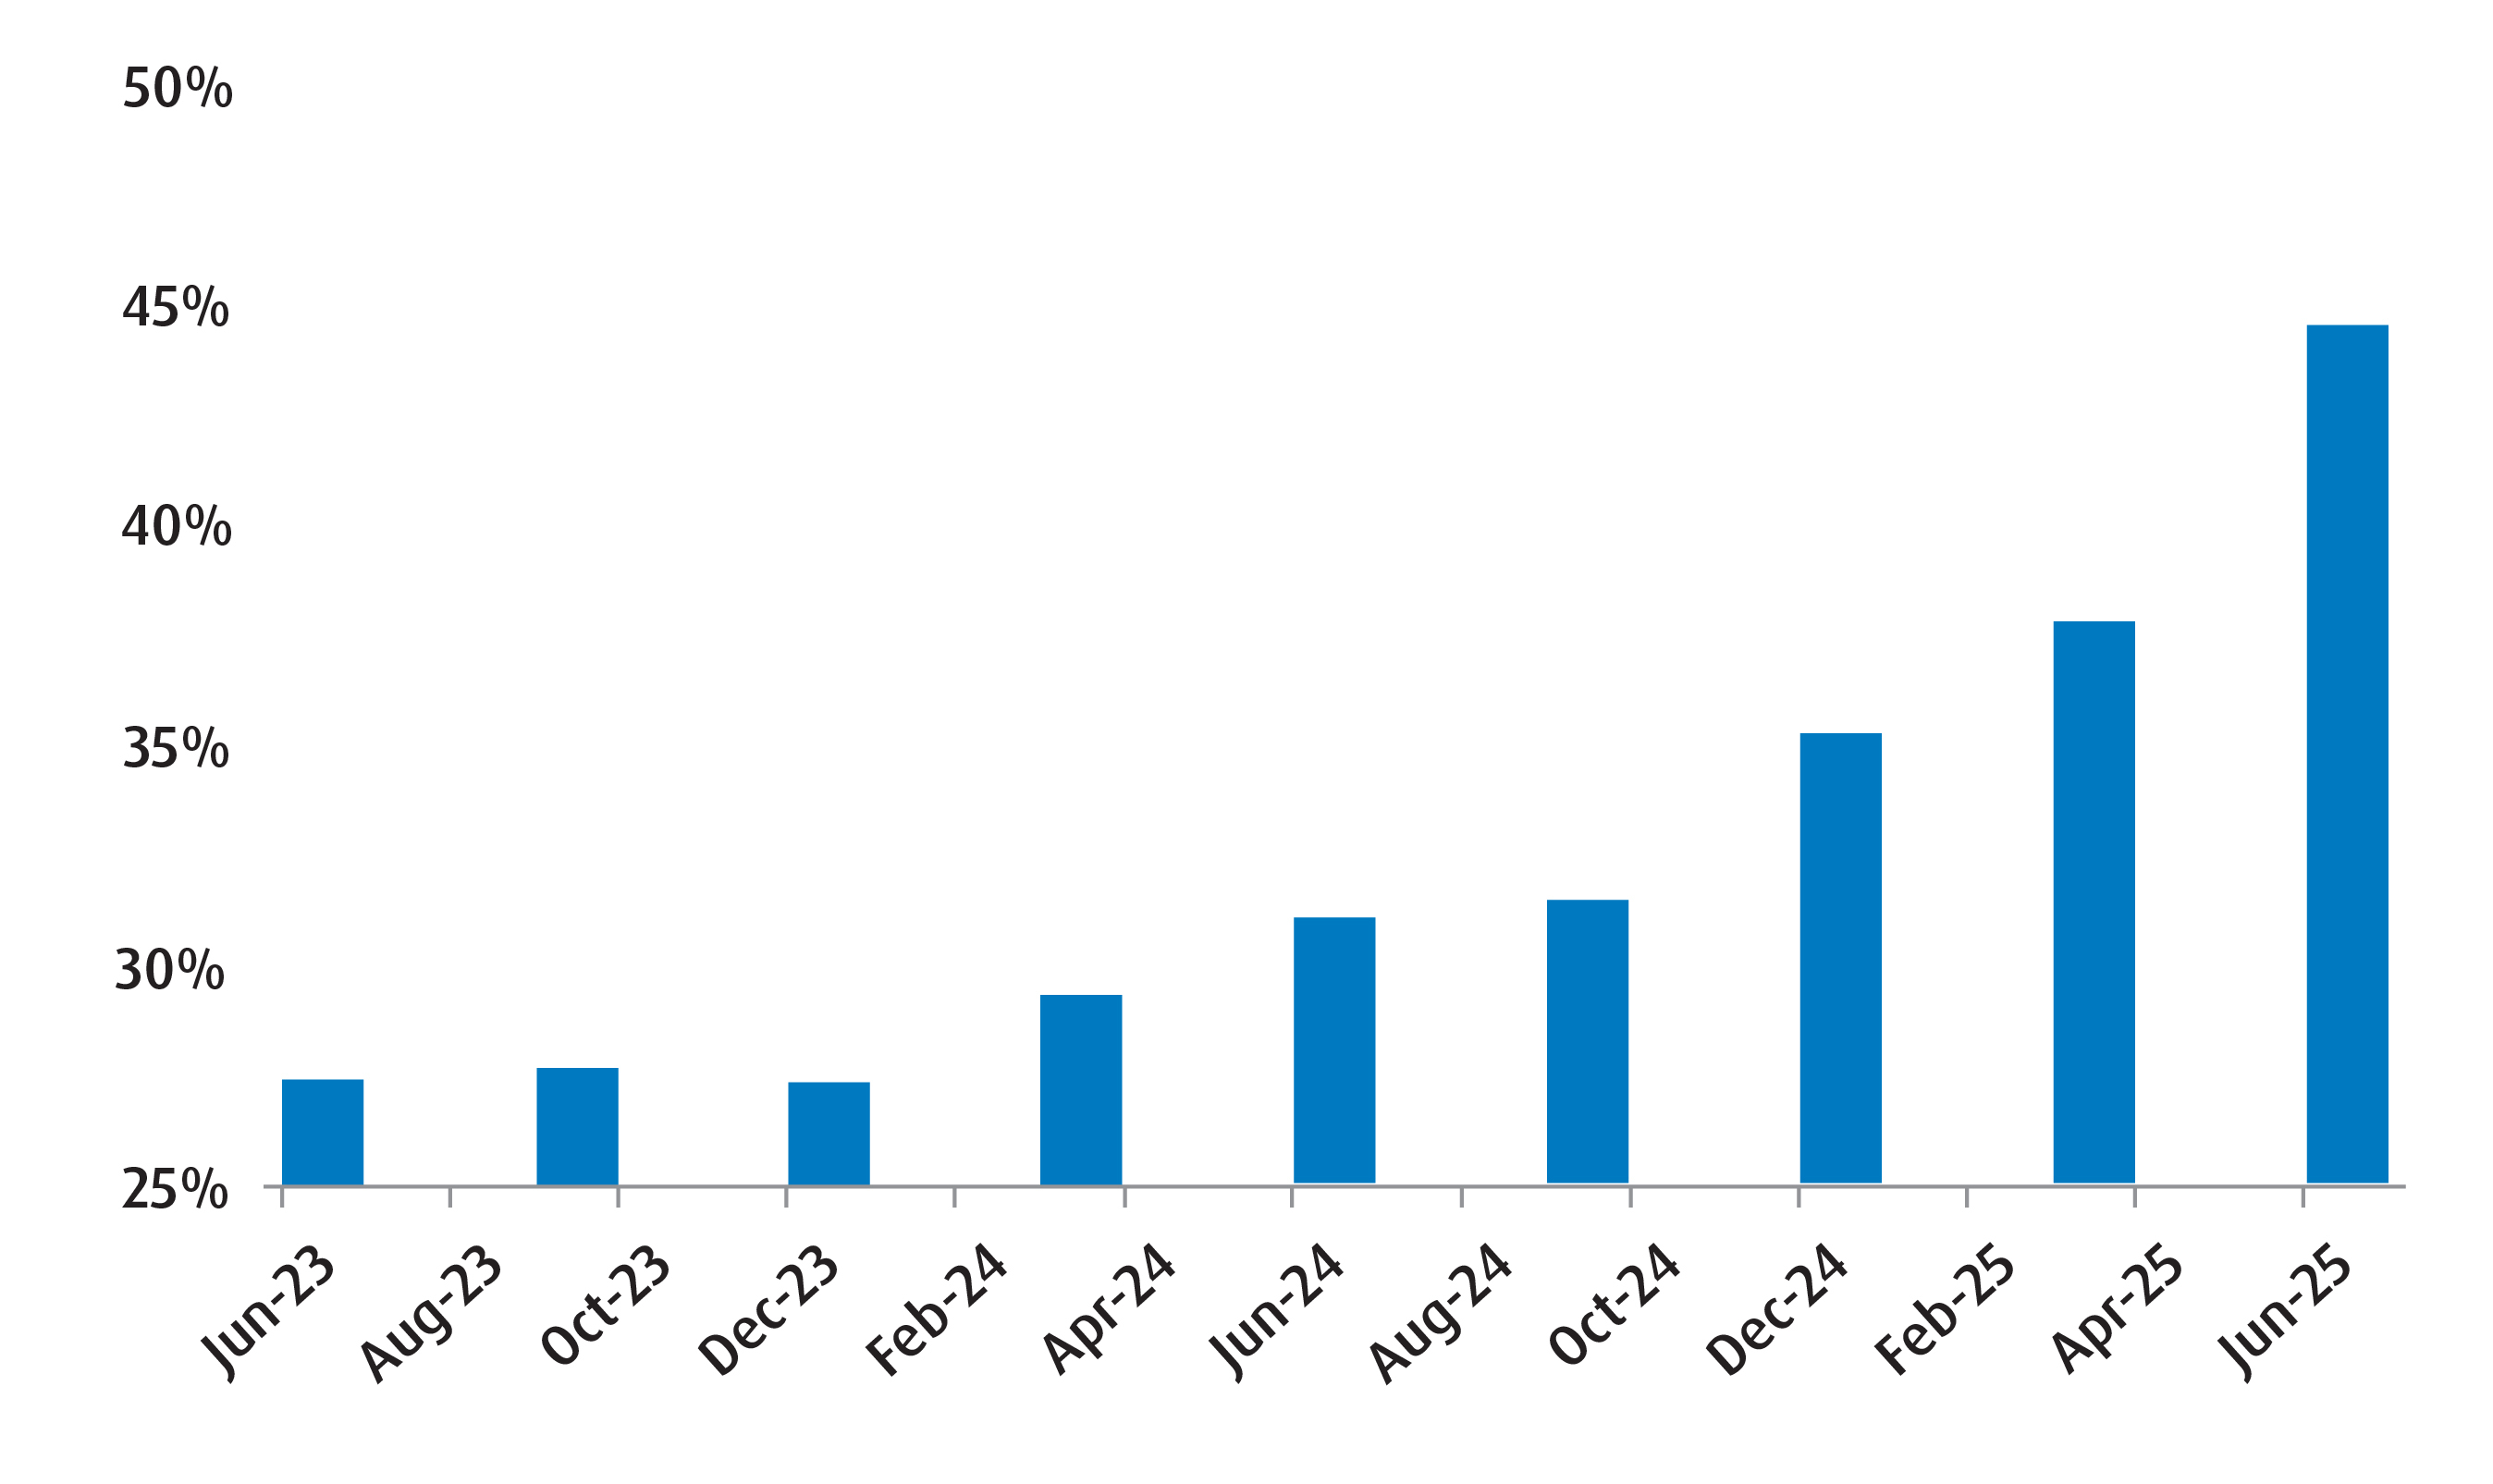
However, we do know that commitments to AI capex are increasing. And as these commitments increase, it will be harder for today’s generation of tech firms to continue to finance them from their current operating cash flows. An easy way to see this is from the capex/EBITDA ratio, which gives us a sense of just how much of a company’s earnings (before interest, taxes, depreciation, and amortization) are reinvested back into capital assets – including AI. The higher the ratio, the more likely it is that firms will run into cash flow pressures, which implies that they’ll need to look at external financing (debt) to maintain the same pace of capital expenditures. From Chart 2, we can see that this ratio has been rising for the Mag 7 (plus Oracle) over time.
Chart 2 – Capex/EBITDA ratio is rising
Naturally, an increase in debt financing will bring some complications, including additional scrutiny on capex rates of return. If those rates don’t clear important hurdle rates, then the risk is firms will dial back on AI spending – which is something that (as we’ve covered in prior reports) the markets are not pricing in just yet.
However, for now, we’re going to continue to lean into the AI capex cycle. We’re still expecting another quarter or two of strong growth while favourable tax treatments (courtesy of the‘One Big Beautiful Bill Act’) should continue to provide a strong tailwind.
We’ll continue to play this theme via ZUQ (which contains a fair bit of tech exposure) for now. Within our tactical portfolio, we continue to see value in holding ZWT. Investors seeking a pure-play exposure to the U.S. Technology sector can also consider ZXLK.
Performance (%)
Year-to-date |
1-month |
3-month |
6- month |
1-year |
3-year |
5-year |
10-year |
Since inception |
|
7.69 |
4.70 |
8.36 |
10.91 |
13.61 |
26.95 |
15.83 |
16.21 |
16.52 |
|
15.44 |
6.84 |
11.82 |
29.23 |
31.41 |
42.87 |
- |
- |
20.91 |
|
Returns are not available as there is less than one year’s performance data. |
|||||||||
Bloomberg, BMO Global Asset Management, as of September 30, 2025. Inception date for ZUQ = November 5, 2014, ZWT = January 20, 2021, ZXLK = February 4, 2025.
Disclaimers
For Advisor use.
The communication is for information purposes. The information contained herein is not, and should not be construed as, investment, tax or legal advice to any party. Particular investments and/or trading strategies should be evaluated relative to the individual’s investment objectives and professional advice should be obtained with respect to any circumstance.
The viewpoints expressed by the author represents their assessment of the markets at the time of publication. Those views are subject to change without notice at any time. The information provided herein does not constitute a solicitation of an offer to buy, or an offer to sell securities nor should the information be relied upon as investment advice. Past performance is no guarantee of future results. This communication is intended for informational purposes only.
The portfolio holdings are subject to change without notice and only represent a small percentage of portfolio holdings. They are not recommendations to buy or sell any particular security.
The ETF referred to herein is not sponsored, endorsed, or promoted by MSCI and MSCI bears no liability with respect to the ETF or any index on which such ETF is based. The ETF’s prospectus contains a more detailed description of the limited relationship MSCI has with the Manager and any related ETF.
Any statement that necessarily depends on future events may be a forward-looking statement. Forward-looking statements are not guarantees of performance. They involve risks, uncertainties and assumptions. Although such statements are based on assumptions that are believed to be reasonable, there can be no assurance that actual results will not differ materially from expectations. Investors are cautioned not to rely unduly on any forward-looking statements. In connection with any forward-looking statements, investors should carefully consider the areas of risk described in the most recent prospectus.
Distribution yields are calculated by using the most recent regular distribution, or expected distribution, (which may be based on income, dividends, return of capital, and option premiums, as applicable) and excluding additional year end distributions, and special reinvested distributions annualized for frequency, divided by current net asset value (NAV). The yield calculation does not include reinvested distributions.
Distributions are not guaranteed, may fluctuate and are subject to change and/or elimination. Distribution rates may change without notice (up or down) depending on market conditions and NAV fluctuations.
The payment of distributions should not be confused with the BMO ETF’s performance, rate of return or yield. If distributions paid by a BMO ETF are greater than the performance of the investment fund, your original investment will shrink. Distributions paid as a result of capital gains realized by a BMO ETF, and income and dividends earned by a BMO ETF, are taxable in your hands in the year they are paid.
Your adjusted cost base will be reduced by the amount of any returns of capital. If your adjusted cost base goes below zero, you will have to pay capital gains tax on the amount below zero.
Cash distributions, if any, on units of a BMO ETF (other than accumulating units or units subject to a distribution reinvestment plan) are expected to be paid primarily out of dividends or distributions, and other income or gains, received by the BMO ETF less the expenses of the BMO ETF, but may also consist of non-taxable amounts including returns of capital, which may be paid in the manager’s sole discretion. To the extent that the expenses of a BMO ETF exceed the income generated by such BMO ETF in any given month, quarter, or year, as the case may be, it is not expected that a monthly, quarterly, or annual distribution will be paid. Distributions, if any, in respect of the accumulating units of BMO Short Corporate Bond Index ETF, BMO Short Federal Bond Index ETF, BMO Short Provincial Bond Index ETF, BMO Ultra Short-Term Bond ETF and BMO Ultra Short-Term US Bond ETF will be automatically reinvested in additional accumulating units of the applicable BMO ETF. Following each distribution, the number of accumulating units of the applicable BMO ETF will be immediately consolidated so that the number of outstanding accumulating units of the applicable BMO ETF will be the same as the number of outstanding accumulating units before the distribution. Non-resident unitholders may have the number of securities reduced due to withholding tax. Certain BMO ETFs have adopted a distribution reinvestment plan, which provides that a unitholder may elect to automatically reinvest all cash distributions paid on units held by that unitholder in additional units of the applicable BMO ETF in accordance with the terms of the distribution reinvestment plan. For further information, see the distribution policy in the BMO ETFs’ prospectus.
Past Performance is not indicative of future results.
The Select Sector SPDR Trust consists of eleven separate investment portfolios (each a “Select Sector SPDR ETF” or an “ETF” and collectively the “Select Sector SPDR ETFs” or the “ETFs”). Each Select Sector SPDR ETF is an “index fund” that invests in a particular sector or group of industries represented by a specified Select Sector Index. The companies included in each Select Sector Index are selected on the basis of general industry classification from a universe of companies defined by the S&P 500®. The investment objective of each ETF is to provide investment results that, before expenses, correspond generally to the price and yield performance of publicly traded equity securities of companies in a particular sector or group of industries, as represented by a specified market sector index.
The Index is a product of S&P Dow Jones Indices LLC or its affiliates (“SPDJI”), and has been licensed for use by the Manager. S&P®, S&P 500®, US 500, The 500, iBoxx®, iTraxx® and CDX® are trademarks of S&P Global, Inc. or its affiliates (“S&P”) and Dow Jones® is a registered trademark of Dow Jones Trademark Holdings LLC (“Dow Jones”), and these trademarks have been licensed for use by SPDJI and sublicensed for certain purposes by the Manager. The ETF is not sponsored, endorsed, sold or promoted by SPDJI, Dow Jones, S&P, their respective affiliates, and none of such parties make any representation regarding the advisability of investing in such product(s) nor do they have any liability for any errors, omissions, or interruptions of the Index.
The S&P 500 Index is an unmanaged index of 500 common stocks that is generally considered representative of the U.S. stock market. The index is heavily weighted toward stocks with large market capitalizations and represents approximately two-thirds of the total market value of all domestic common stocks.
The S&P 500 Index figures do not reflect any fees, expenses or taxes. An investor should consider investment objectives, risks, fees and expenses before investing.
You cannot invest directly in an index.
Commissions, management fees and expenses all may be associated with investments in exchange traded funds. Please read the ETF Facts or prospectus of the BMO ETFs before investing. The indicated rates of return are the historical annual compounded total returns including changes in unit value and reinvestment of all dividends or distributions and do not take into account sales, redemption, distribution or optional charges or income taxes payable by any unitholder that would have reduced returns. Exchange traded funds are not guaranteed, their values change frequently and past performance may not be repeated.
For a summary of the risks of an investment in the BMO ETFs, please see the specific risks set out in the BMO ETF’s prospectus. BMO ETFs trade like stocks, fluctuate in market value and may trade at a discount to their net asset value, which may increase the risk of loss. Distributions are not guaranteed and are subject to change and/or elimination.
BMO ETFs are managed by BMO Asset Management Inc., which is an investment fund manager and a portfolio manager, and a separate legal entity from Bank of Montreal.
BMO Global Asset Management is a brand name under which BMO Asset Management Inc. and BMO Investments Inc. operate.
“BMO (M-bar roundel symbol)” is a registered trademark of Bank of Montreal, used under licence.