Will Canadian Banks See Even Better Earnings in 2026?


Summary
- Diversification Driving Growth: Despite the slowest loan growth in decades, Canadian banks delivered nearly 10% revenue growth, with non-interest income (trading and fee-based) now making up 54% of total revenues.
- Mixed Core Performance & Cautious Outlook: Capital markets and wealth management were strong, while traditional lending lagged; banks remain cautious on credit risk, increasing provisions for non-impaired loans.
- Valuation & Strategy Implications: Robust capital positions support dividends and buybacks, creating rationale for an equal-weight beta exposure such as ZEB. For those with valuation concerns, we suggest covered call strategies like ZWB to smooth returns and limit volatility.
Among the many hats we’re asked to wear at times, moonlighting as financial sector analysts is one of our favourites. Each quarter, we’re asked to come up with the important themes that characterize the earnings releases of the ‘Big Six’ Canadian banks and what they mean for our ETF product suite. This is especially important now given the question marks with respect to the economy and whether the Bank of Canada (BoC) might actually be talking up rate hikes at this time next year.
So, what were the important themes from the Big Six’s latest earnings? A few worth noting:
- First, strong results from capital markets (primarily trading) and wealth management carried the quarter.
- Second, personal and commercial lending continues to struggle (especially in Canada). Pre-tax, pre-provision earnings were softer than expected in that segment for the most part.
- Third, the uncertain macro backdrop is leading to different assessments of credit risks going forward. For instance, we saw variation when it came to provisions for credit losses (PCLs) with a few banks increasing them for stage 1 and 2 loans (non-impaired). Again, that implies that banks are still cautious about the current economic backdrop.
- Fourth, CAD banks still retain very strong capital positions. That allowed a few of them to increase dividends and conduct share buybacks this quarter and will remain a key strength going forward.
If there is a single, unifying theme at play here, it’s this: Canadian banks have become especially adept at generating revenues outside of traditional retail banking. Indeed, the migration toward fee-based, diversified revenue streams has been instrumental in maintaining profitability this year.
Consider the following: Chart 1 shows the annual growth in loans (both mortgage and non-mortgage) for Canadian charted bank balance sheets going back to the turn of the century against total net revenues. If current patterns persist, this calendar year will mark the slowest pace in loan growth in a non-crisis year (excluding 2008, 2009 and 2020) since 2003. Despite this, revenues grew by close to 10% according to our estimates – among the best years of revenue growth this century.
Chart 1 – CAD Banks Don’t Need Loan Growth to Drive Net Revenues
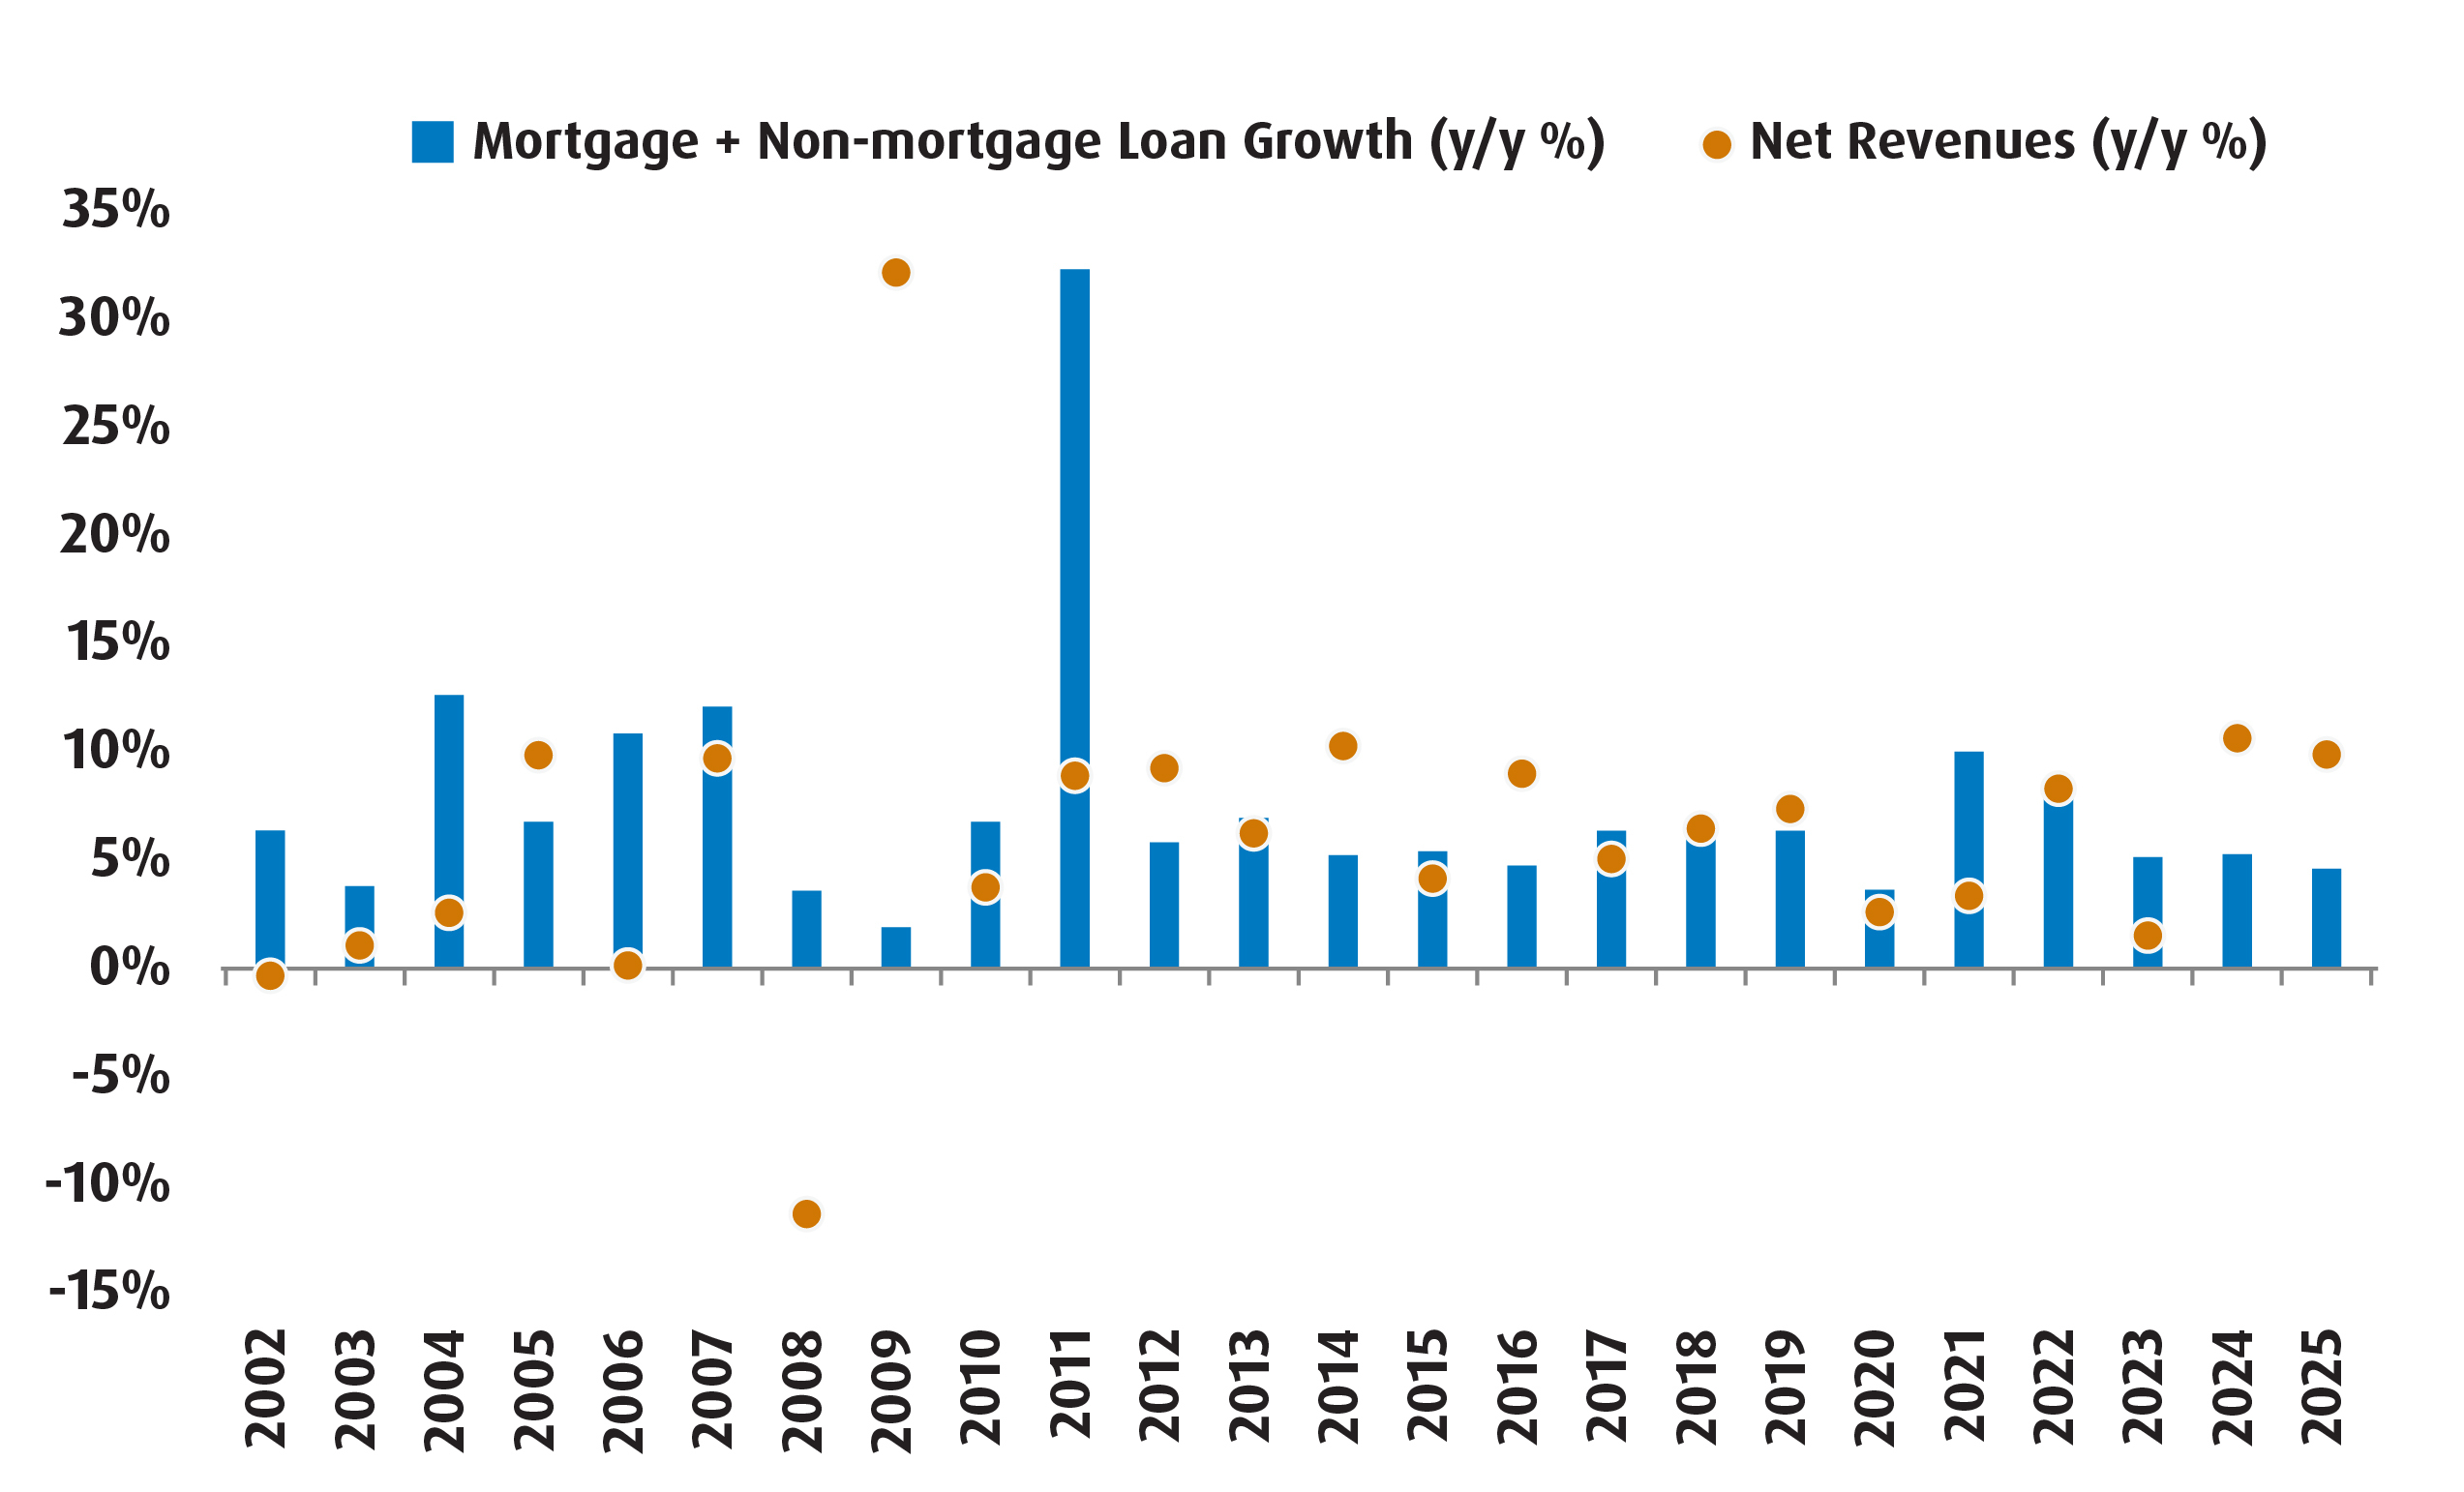
Loan growth is estimated using the information on chartered Canadian bank balance sheets each year. Another way to demonstrate this is to look at the portion of non-interest income that now makes up total revenues compared to prior periods. The percentage of trading revenues and other fee-based income across business lines accounted for 54% of total revenues last year. For most of this century, it accounted for less than 50% (if we exclude the crisis years of 2008, 2009 and 2020).
Of course, the shift towards diversified revenue streams is augmented by strong capital positions. Each of the Big Six retain CET11 and total capital that are well above regulatory benchmarks. The increased reliance on revenue generation outside of retail lending means that banks can more easily return capital to shareholders (via dividends and share buybacks). It also means that the potential for capital deployment via lending increases at the margin.
Looking ahead to 2026, there are opportunities aplenty for Canadian banks for capital deployment. Private sector participation in federal infrastructure, defense and housing initiatives implies an increase in capital demand. At the same time, a lower starting point for interest rates and a possible stabilization in home prices could lead to an increase in mortgage demand. These will be amplified if the CUSMA2 negotiations go smoothly.
But if you’re looking for another source of risk outside of that, it’s valuation as CAD banks are trading relatively rich right now (see Chart 2). That is an observation that might tip the scales in favour of a covered call strategy, like ZWB.
Chart 2 – Price-to-Earnings for Canadian Banks Looks Rich
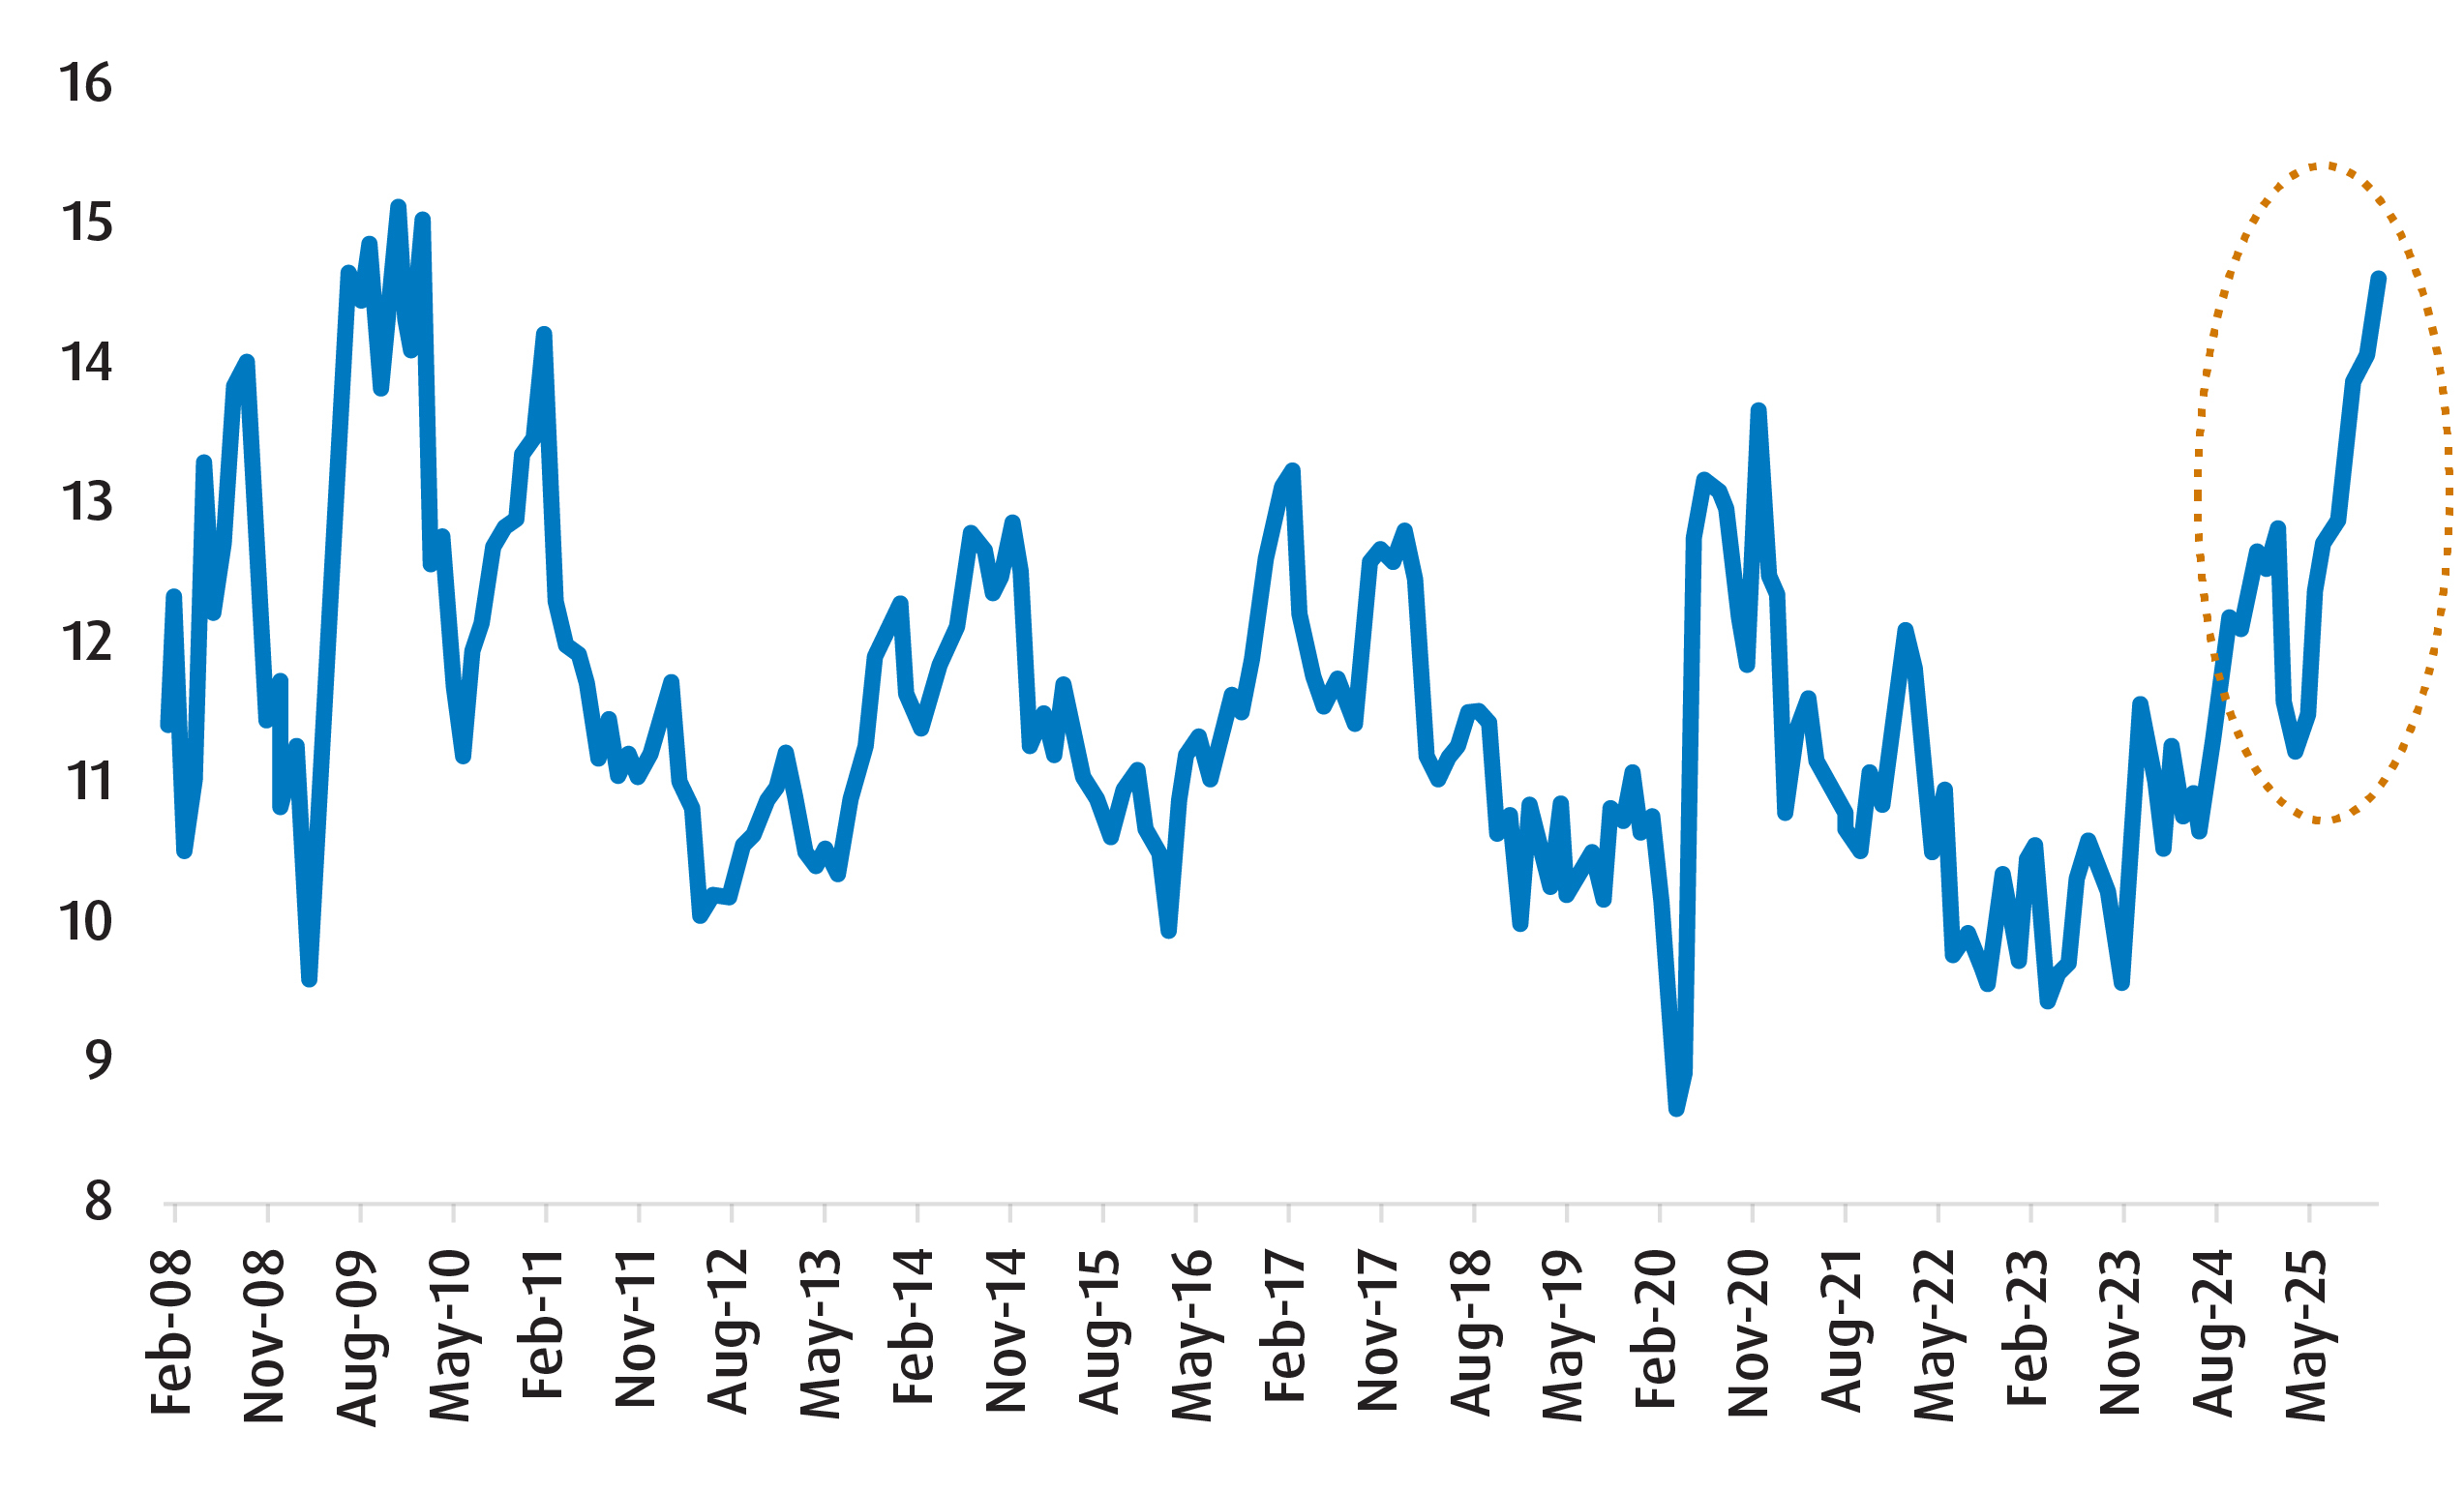
To reiterate, we view the Canadian banks’ robust capital positions as supporting dividends and buybacks through next year, creating rationale for an equal-weight beta exposure such as ZEB. For those with valuation concerns, we suggest covered call strategies like ZWB.
Performance (%)
Fund name |
Ticker |
YTD |
1 mo |
3 mo |
6 mo |
1 Year |
3 Year |
5 Year |
10 Year |
Since Inception |
Inception date |
ZEB |
36.60% |
4.32% |
13.07% |
28.05% |
35.00% |
20.95% |
19.32% |
14.00% |
12.60% |
2009-10-20 |
|
ZWB |
28.90% |
4.00% |
11.49% |
23.52% |
27.69% |
15.66% |
14.43% |
10.66% |
9.90% |
2011-01-28 |
Bloomberg, as of November 28, 2026
1 Common Equity Tier 1 (CET1) capital is the highest quality, core capital a bank holds, representing its strongest financial buffer made up of common shares, retained earnings, and other reserves, designed to absorb unexpected losses and keep the bank stable during crises.
2 CUSMA (Canada-United States-Mexico Agreement) is the current free trade pact for North America.
Disclaimers:
The communication is for information purposes. The information contained herein is not, and should not be construed as, investment, tax or legal advice to any party. Particular investments and/or trading strategies should be evaluated relative to the individual’s investment objectives and professional advice should be obtained with respect to any circumstance.
The viewpoints expressed by the author represent their assessment of the markets at the time of publication. Those views are subject to change without notice at any time. The information provided herein does not constitute a solicitation of an offer to buy, or an offer to sell securities nor should the information be relied upon as investment advice. Past performance is no guarantee of future results. This communication is intended for informational purposes only.
The portfolio holdings are subject to change without notice and only represent a small percentage of portfolio holdings. They are not recommendations to buy or sell any particular security.
Any statement that necessarily depends on future events may be a forward-looking statement. Forward-looking statements are not guarantees of performance. They involve risks, uncertainties and assumptions. Although such statements are based on assumptions that are believed to be reasonable, there can be no assurance that actual results will not differ materially from expectations. Investors are cautioned not to rely unduly on any forward-looking statements. In connection with any forward-looking statements, investors should carefully consider the areas of risk described in the most recent prospectus.
Solactive AG (“Solactive”) is the licensor of Solactive Index. The ETF that is based on the Solactive Index is not sponsored, endorsed, promoted or sold by Solactive in any way and Solactive makes no express or implied representation, guarantee or assurance with regard to: (a) the advisability in investing in the ETF; (b) the quality, accuracy and/or completeness of the Solactive Index; and/or © the results obtained or to be obtained by any person or entity from the use of the Solactive Index. Solactive reserves the right to change the methods of calculation or publication with respect to the Solactive Index. Solactive shall not be liable for any damages suffered or incurred as a result of the use (or inability to use) of the Solactive Index.
Past Performance is not indicative of future results.
Commissions, management fees and expenses (if applicable) all may be associated with investments in BMO ETFs and ETF Series of the BMO Mutual Funds. Please read the ETF facts or prospectus of the relevant BMO ETF or ETF Series before investing. BMO ETFs and ETF Series are not guaranteed, their values change frequently and past performance may not be repeated.
For a summary of the risks of an investment in the BMO ETFs or ETF Series of the BMO Mutual Funds, please see the specific risks set out in the prospectus. BMO ETFs and ETF Series trade like stocks, fluctuate in market value and may trade at a discount to their net asset value, which may increase the risk of loss. Distributions are not guaranteed and are subject to change and/or elimination.
BMO ETFs are managed and administered by BMO Asset Management Inc., an investment fund manager and a portfolio manager, and a separate legal entity from Bank of Montreal. The ETF Series of the BMO Mutual Funds are managed by BMO Investments Inc., an investment fund manager and a separate legal entity from Bank of Montreal.
BMO Global Asset Management is a brand name under which BMO Asset Management Inc. and BMO Investments Inc. operate.
“BMO (M-bar roundel symbol)” is a registered trademark of Bank of Montreal, used under licence.