Fixed Income Strategy Report (Q4 2025)
All prices, returns and portfolio weights are as of market close on September 30, 2025, unless otherwise indicated.


Reallocation over rotation
- In the Q3 edition of this report, we were more constructive on our outlook for the U.S. fixed income space relative to Canada. This reflected our view at the time that the market was underpricing the risk of Federal Reserve (Fed) rate cuts in the fall, while the Bank of Canada (BoC) was likely at the end of its cycle.
- Fast forward three months, we’ve largely seen this story play out. U.S. rates have outperformed as Canadian dollar (CAD)-U.S. dollar (USD) spreads have tightened aggressively across the curve.
- But looking ahead, we are less optimistic on U.S. rates from here for a few reasons. First, the market has shifted and done a complete 180 degrees on the Fed. Indeed, we’d now regard the market as overestimating the degree of easing that is required from here.
- While the Fed may be accentuating its concerns with respect to the employment side of its mandate, there are clear signs that price pressures will remain a bit more persistent than many believe. That is due to several reasons that we’ve covered in prior notes – including the uneven distribution of tariffs (and the resulting passthrough) as well as the “stickiness” of shelter prices. As the market reassesses its call on the Federal Open Market Committee, we expect that front-end yields could drift higher.
- For the long end of the U.S. curve, we’ve modified our view to a degree. While we acknowledge that supply risks are still a concern – the fact the Fed has re-started its easing cycle does suggest that the supply/demand balance is marginally better than it was a few months back. That tells us that a backup in yields might find a better equilibrium for new buyers to step in.
- In Canada, we’re increasing our allocation for the months ahead. This reflects our view that the BoC is likely to ease 1-2 more times by end-Q1 2026, and also our view that the sub-sovereign CAD credit space should hold up reasonably well going forward.
- While many will quibble with how tight CAD corporate spreads are to benchmark, we’d be remiss if we didn’t point out two things:
- First, investors in CAD investment grade (IG) products are better compensated for taking on credit risk (relative to U.S. investment grade). For instance, if we normalize current spreads relative to the yield provided (which captures how much of the index yield is coming from credit risk), we can see that investors in CAD IG credit are better compensated.
- Second, the lack of diversity in CAD corporate issuance is precisely why spreads back up by less than they do in the U.S. This means that CAD IG is a lower beta play on corporate credit.
- For our income portfolio, we are sticking with the same securities as we had in Q3. The only difference is that we’re changing the weights to bring the portfolio into better alignment with our views. That means an increase in weights for CAD fixed income and a decrease for U.S. fixed income.
- On the currency front, we are hedging the same degree of exposure as we had in Q3 (where 75% of our U.S. exposure was hedged). We remain circumspect on the ability of the USD to strengthen in the coming quarters due to a mix of factors.
Fixed Income model portfolio for Q4 2025
ETF Name |
Ticker |
Weight |
Duration |
Yield-to-maturity |
Management Fee |
Exposure |
Position |
15.0% |
7.05 |
3.21% |
0.09% |
Canada |
Core |
||
20.0% |
3.05 |
6.65% |
0.45% |
Canada |
Core |
||
25.0% |
2.05 |
3.60% |
0.25% |
Canada |
Core |
||
5.0% |
2.42 |
3.72% |
0.20% |
United States |
Non-Traditional |
||
10.0% |
5.98 |
4.29% |
0.25% |
United States |
Core |
||
5.0% |
5.98 |
4.29% |
0.25% |
United States |
Core |
||
20.0% |
0.13 |
0.00% |
0.20% |
United States |
Non-Traditional |
||
Total Portfolio |
100.0% |
3.22 |
3.54% |
0.25% |
BMO Global Asset Management. Model portfolio for illustrative purposes only. The information contained herein is not, and should not be construed as, investment, tax or legal advice to any party. These are not recommendations to buy or sell any particular security. Particular investments and/or trading strategies should be evaluated relative to the individual’s risk profile and investment objectives. Professional advice should be obtained with respect to any circumstance.
* Weighted average yield to maturity: The market value-weighted average yield to maturity includes coupon payments and any capital gain or loss that the investor will realize by holding the bonds to maturity.
Source: Bloomberg, BMO Asset Management Inc., as of September 30, 2025.
Changes from Q3
Sell/Trim |
Ticker |
Old weight |
(%) |
New weight |
Buy/Add |
Ticker |
Old weight |
% |
New weight |
15% |
-10% |
5% |
5% |
10% |
15% |
||||
25% |
-15% |
10% |
15% |
10% |
25% |
||||
0% |
5% |
5% |
|||||||
BMO Global Asset Management, as of September 30, 2025.
Performance (%)
Ticker |
Year-to-date |
1-month |
3-month |
6-month |
1-year |
3-year |
5-year |
10-year |
Since inception |
Inception date |
13.01% |
1.11% |
4.61% |
10.65% |
18.49% |
13.91% |
11.32% |
7.30% |
3.28% |
2012-11-14 |
|
2.72% |
1.82% |
1.32% |
0.69% |
2.58% |
4.53% |
-0.28% |
1.87% |
2.36% |
2014-02-10 |
|
4.78% |
0.98% |
1.57% |
2.34% |
1.09% |
— |
— |
— |
2.32% |
2023-01-23 |
|
Returns are not available as there is less than one year’s performance data. |
2025-04-30 |
|||||||||
4.53% |
0.95% |
2.04% |
3.36% |
6.59% |
7.47% |
— |
— |
4.20% |
2022-02-07 |
|
2.22% |
1.27% |
3.77% |
-0.86% |
8.51% |
5.59% |
— |
— |
5.64% |
2021-01-20 |
|
2.69% |
2.48% |
4.31% |
-0.10% |
5.76% |
— |
— |
— |
5.09% |
2023-01-23 |
|
Bloomberg, as of September 30, 2025.
Q4 model portfolio weightings by security
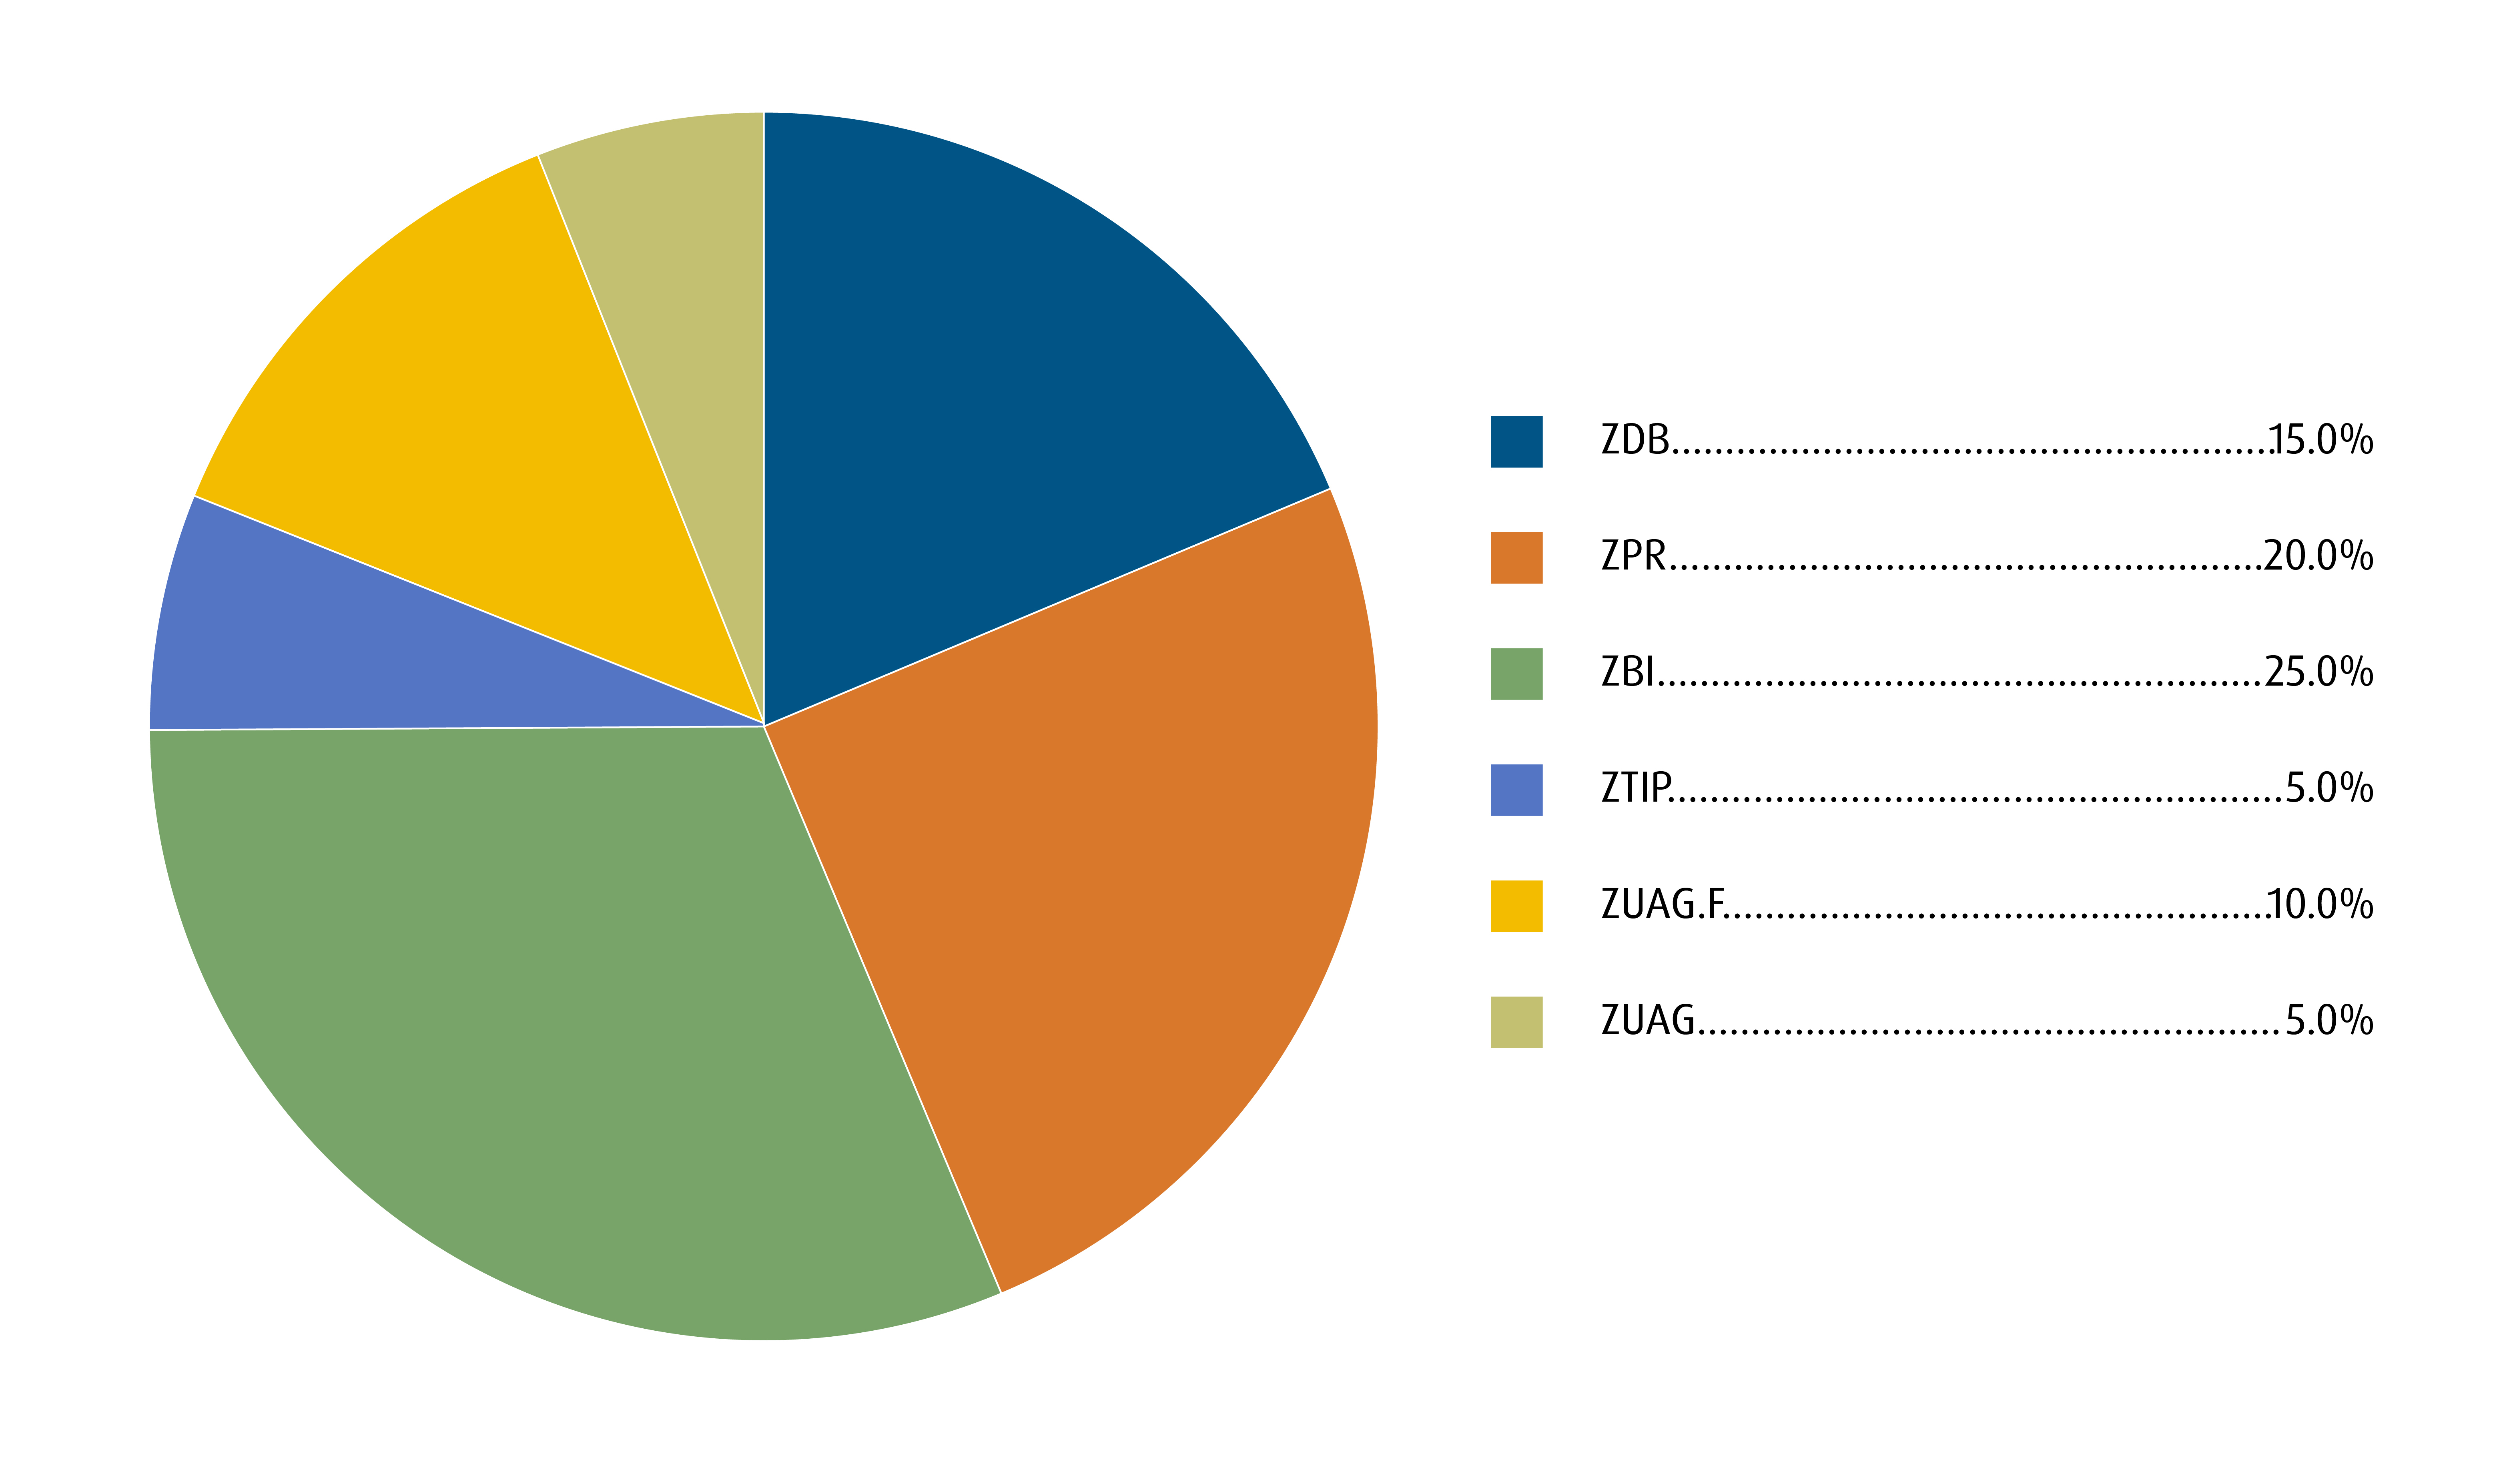
BMO Global Asset Management. As of September 30, 2025. Model portfolio for illustrative purposes only.
Credit summary
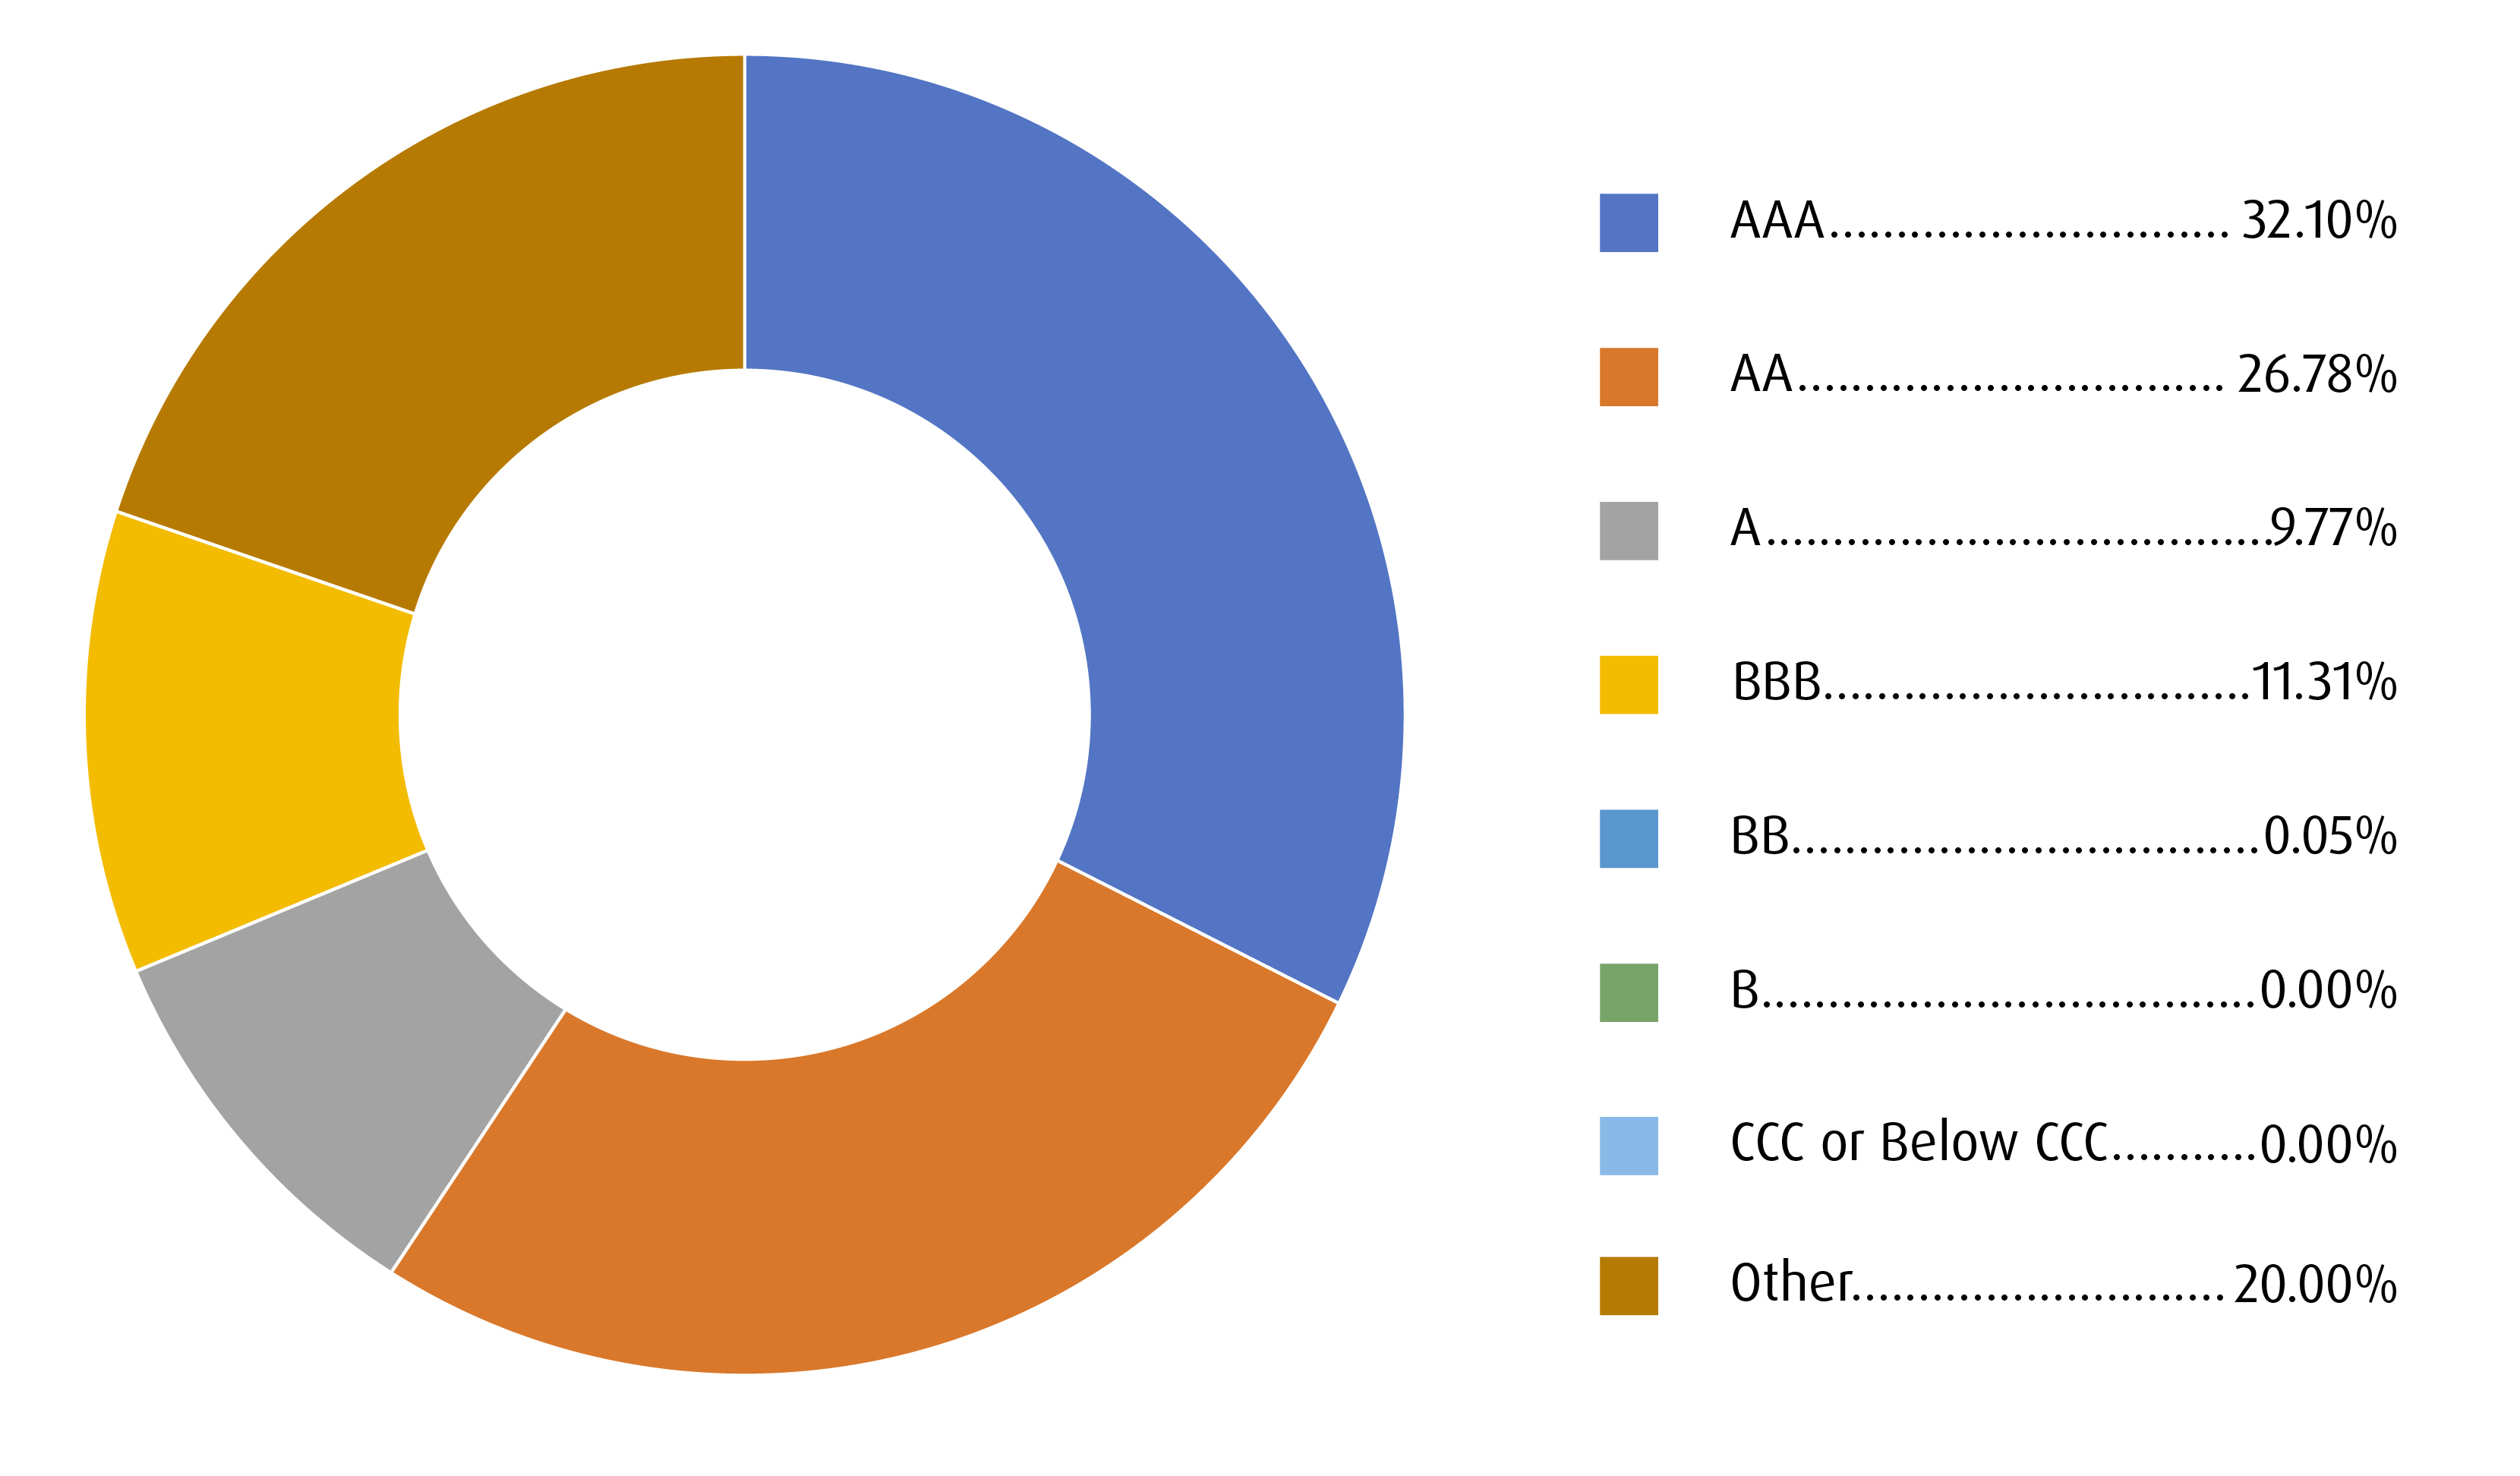
Credit quality summary of model fixed income portfolio. Ratings are composite scoring from various ratings agencies for the underlying securities. BMO Global Asset Management. Model portfolio for illustrative purposes only. As of September 30, 2025.
Term summary
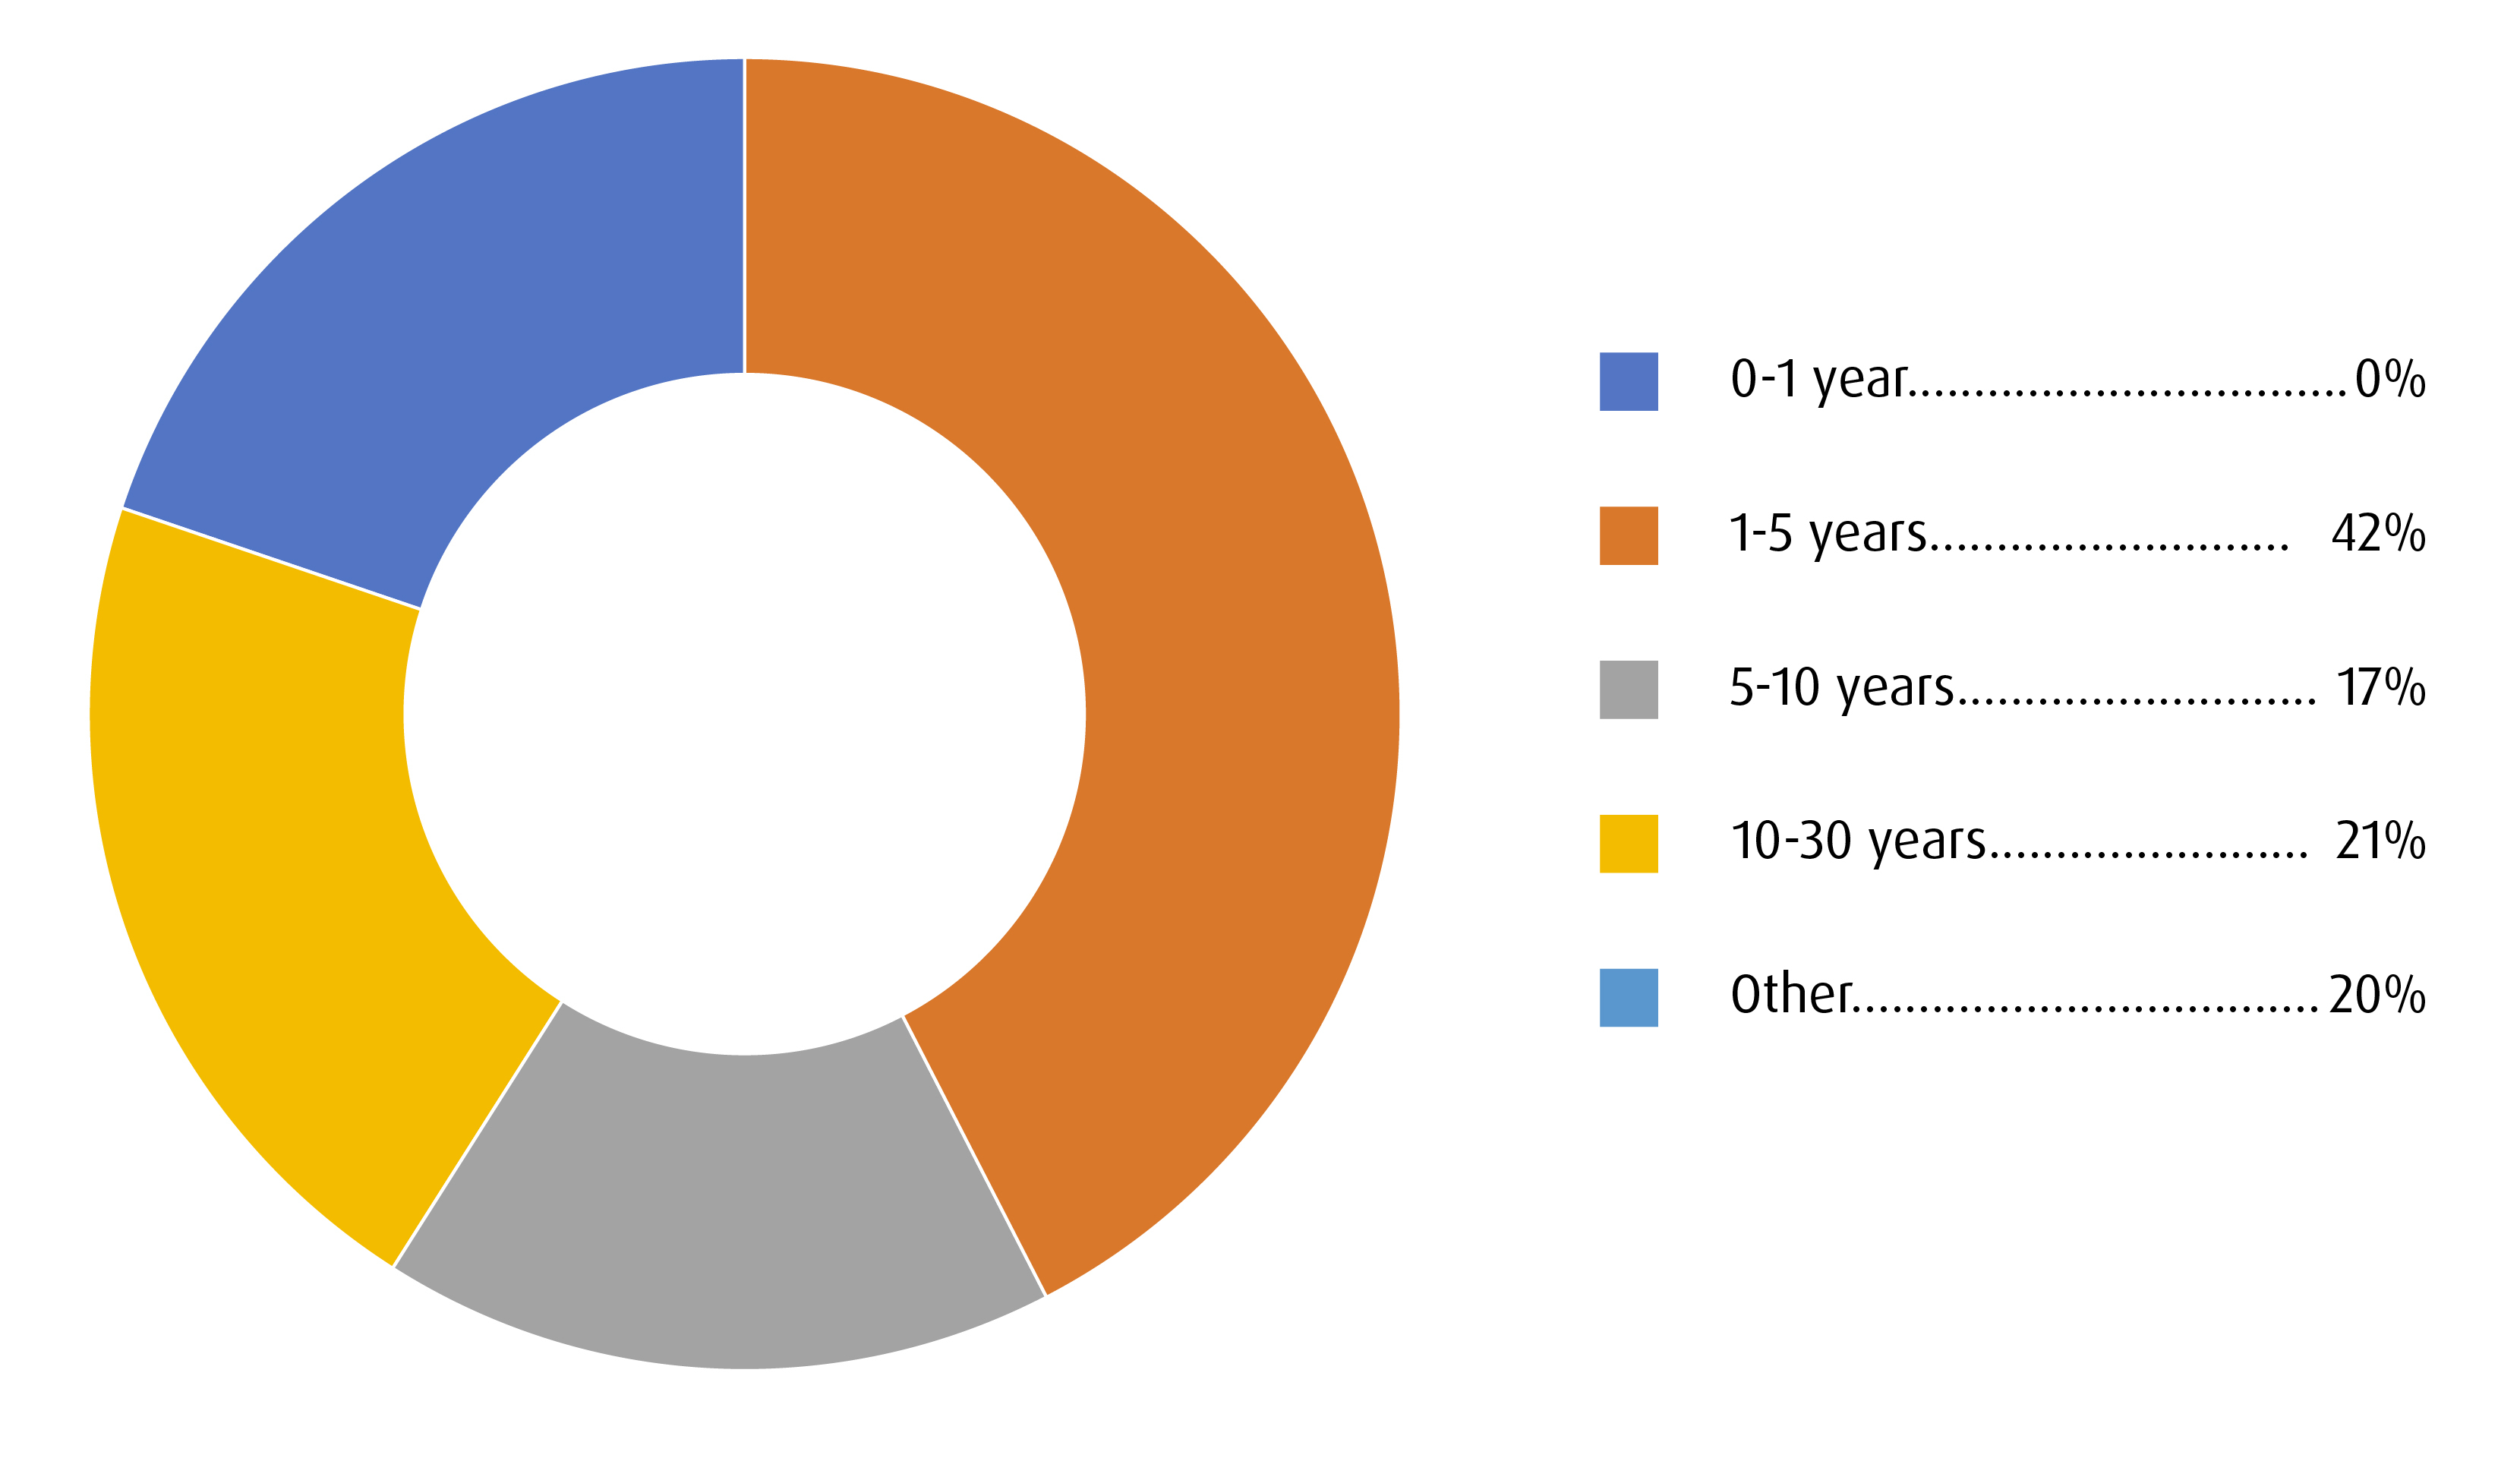
Term summary showing breakdown of average duration of model portfolio securities. BMO Global Asset Management, Bloomberg. Model portfolio for illustrative purposes only. As of September 30, 2025.
Visit bmo.com/etfs or contact Client Services at 1−800−361−1392.
To listen to our Views From the Desk Podcast, please visit bmoetfs.ca.
BMO ETF Podcasts are also available on


Disclaimers
For advisor use only.
The portfolio holdings and asset allocations are subject to change without notice and individual holdings only represent a small percentage of portfolio holdings. They are not recommendations to buy or sell any particular security.
Any statement that necessarily depends on future events may be a forward-looking statement. Forward-looking statements are not guarantees of performance. They involve risks, uncertainties and assumptions. Although such statements are based on assumptions that are believed to be reasonable, there can be no assurance that actual results will not differ materially from expectations. Investors are cautioned not to rely unduly on any forward-looking statements. In connection with any forward-looking statements, investors should carefully consider the areas of risk described in the most recent prospectus.
This communication is intended for informational purposes only and is not, and should not be construed as, investment and/or tax advice to any individual. Particular investments and/or trading strategies should be evaluated relative to each individual’s circumstances. Individuals should seek the advice of professionals, as appropriate, regarding any particular investment. Investors cannot invest directly in an index.
The viewpoints expressed by the author represents their assessment of the markets at the time of publication. Those views are subject to change without notice at any time without any kind of notice. The information provided herein does not constitute a solicitation of an offer to buy, or an offer to sell securities nor should the information be relied upon as investment advice. Past performance is no guarantee of future results.
Index returns do not reflect transactions costs or the deduction of other fees and expenses and it is not possible to invest directly in an Index. Past performance is not indicative of future results.
Commissions, management fees and expenses all may be associated with investments in exchange-traded funds. Please read the ETF Facts or prospectus of the BMO ETFs before investing. The indicated rates of return are the historical annual compounded total returns including changes in unit value and reinvestment of all dividends or distributions and do not take into account sales, redemption, distribution or optional charges or income taxes payable by any unitholder that would have reduced returns. Exchange-traded funds are not guaranteed, their values change frequently and past performance may not be repeated.
For a summary of the risks of an investment in the BMO ETFs, please see the specific risks set out in the BMO ETF’s prospectus. BMO ETFs trade like stocks, fluctuate in market value and may trade at a discount to their net asset value, which may increase the risk of loss. Distributions are not guaranteed and are subject to change and/or elimination.
CLOs are floating- or fixed-rate debt securities issued in different tranches, with varying degrees of risk, by trusts or other special purpose vehicles (“CLO Issuers”) and backed by an underlying portfolio consisting primarily of below investment grade corporate loans.
The BMO ETF pursues its investment objective by investing, under normal circumstances, at least 85% of its net assets in CLOs that, at the time of purchase, are rated AAA or the equivalent by a nationally recognized statistical rating organization. The BMO AAA CLO ETF pursues its investment objective by investing, under normal circumstances, at least 85% of its net assets in CLOs that, at the time of purchase, are rated AAA or the equivalent by a nationally recognized statistical rating organization. The BMO BBB CLO ETF pursues its investment objective by investing, under normal circumstances, at least 75% of its net assets in CLOs that are BBB-rated at the time of purchase.
AAA herein refers to the order of payments, should there be any defaults, and does not represent the ratings of the underlying loans within the CLO. If there are loan defaults or the CLO Issuer’s collateral otherwise underperforms, scheduled payments to senior tranches take precedence over those of mezzanine tranches (a tranche or tranches subordinated to the senior tranche; e.g., AAA tranches are the most senior, while BBB tranches are mezzanine-level), and scheduled payments to mezzanine tranches take precedence over those to subordinated/equity tranches. The riskiest portion is the “Equity” tranche, which bears the first losses and is expected to bear all or the bulk of defaults from the corporate loans held by the CLO Issuer serves to protect the other, more senior tranches from default.Distribution yields are calculated by using the most recent regular distribution, or expected distribution, (which may be based on income, dividends, return of capital, and option premiums, as applicable) and excluding additional year end distributions, and special reinvested distributions annualized for frequency, divided by current net asset value (NAV). The yield calculation does not include reinvested distributions. Distributions are not guaranteed, may fluctuate and are subject to change and/or elimination. Distribution rates may change without notice (up or down) depending on market conditions and NAV fluctuations. The payment of distributions should not be confused with the BMO ETF’s performance, rate of return or yield. If distributions paid by a BMO ETF are greater than the performance of the investment fund, your original investment will shrink. Distributions paid as a result of capital gains realized by a BMO ETF, and income and dividends earned by a BMO ETF, are taxable in your hands in the year they are paid. Your adjusted cost base will be reduced by the amount of any returns of capital. If your adjusted cost base goes below zero, you will have to pay capital gains tax on the amount below zero.
Cash distributions, if any, on units of a BMO ETF (other than accumulating units or units subject to a distribution reinvestment plan) are expected to be paid primarily out of dividends or distributions, and other income or gains, received by the BMO ETF less the expenses of the BMO ETF, but may also consist of non-taxable amounts including returns of capital, which may be paid in the manager’s sole discretion. To the extent that the expenses of a BMO ETF exceed the income generated by such BMO ETF in any given month, quarter, or year, as the case may be, it is not expected that a monthly, quarterly, or annual distribution will be paid. Distributions, if any, in respect of the accumulating units of BMO Short Corporate Bond Index ETF, BMO Short Federal Bond Index ETF, BMO Short Provincial Bond Index ETF, BMO Ultra Short-Term Bond ETF and BMO Ultra Short-Term US Bond ETF will be automatically reinvested in additional accumulating units of the applicable BMO ETF. Following each distribution, the number of accumulating units of the applicable BMO ETF will be immediately consolidated so that the number of outstanding accumulating units of the applicable BMO ETF will be the same as the number of outstanding accumulating units before the distribution. Non-resident unitholders may have the number of securities reduced due to withholding tax. Certain BMO ETFs have adopted a distribution reinvestment plan, which provides that a unitholder may elect to automatically reinvest all cash distributions paid on units held by that unitholder in additional units of the applicable BMO ETF in accordance with the terms of the distribution reinvestment plan. For further information, see the distribution policy in the BMO ETFs’ prospectus.
BMO ETFs are managed and administered by BMO Asset Management Inc., an investment fund manager and a portfolio manager, and a separate legal entity from Bank of Montreal.
BMO Global Asset Management is a brand name under which BMO Asset Management Inc. and BMO Investments Inc. operate.