Fourth Quarter 2025
Portfolio Strategy Report (Q4 2025)
All prices, returns and portfolio weights are as of market close on September 30, 2025, unless otherwise indicated.


The invisible engine effect
There is a deep contradiction between perception and reality that is currently playing out in the U.S. economic landscape. In many ways, it reminds us of the setting to the famous 1999 movie, The Matrix (a friendly spoiler alert for those that haven’t seen it – skip ahead to the next paragraph). In the movie, the world in which the protagonist wakes up is a simulated reality powered by an engine that most don’t see. This “invisible engine” dynamic helps us square the inconsistency between the prevailing narrative of U.S. economic fragility and incoming data that shows resilience.
Chart 1 – Despite headwinds, the U.S. economy remains strong
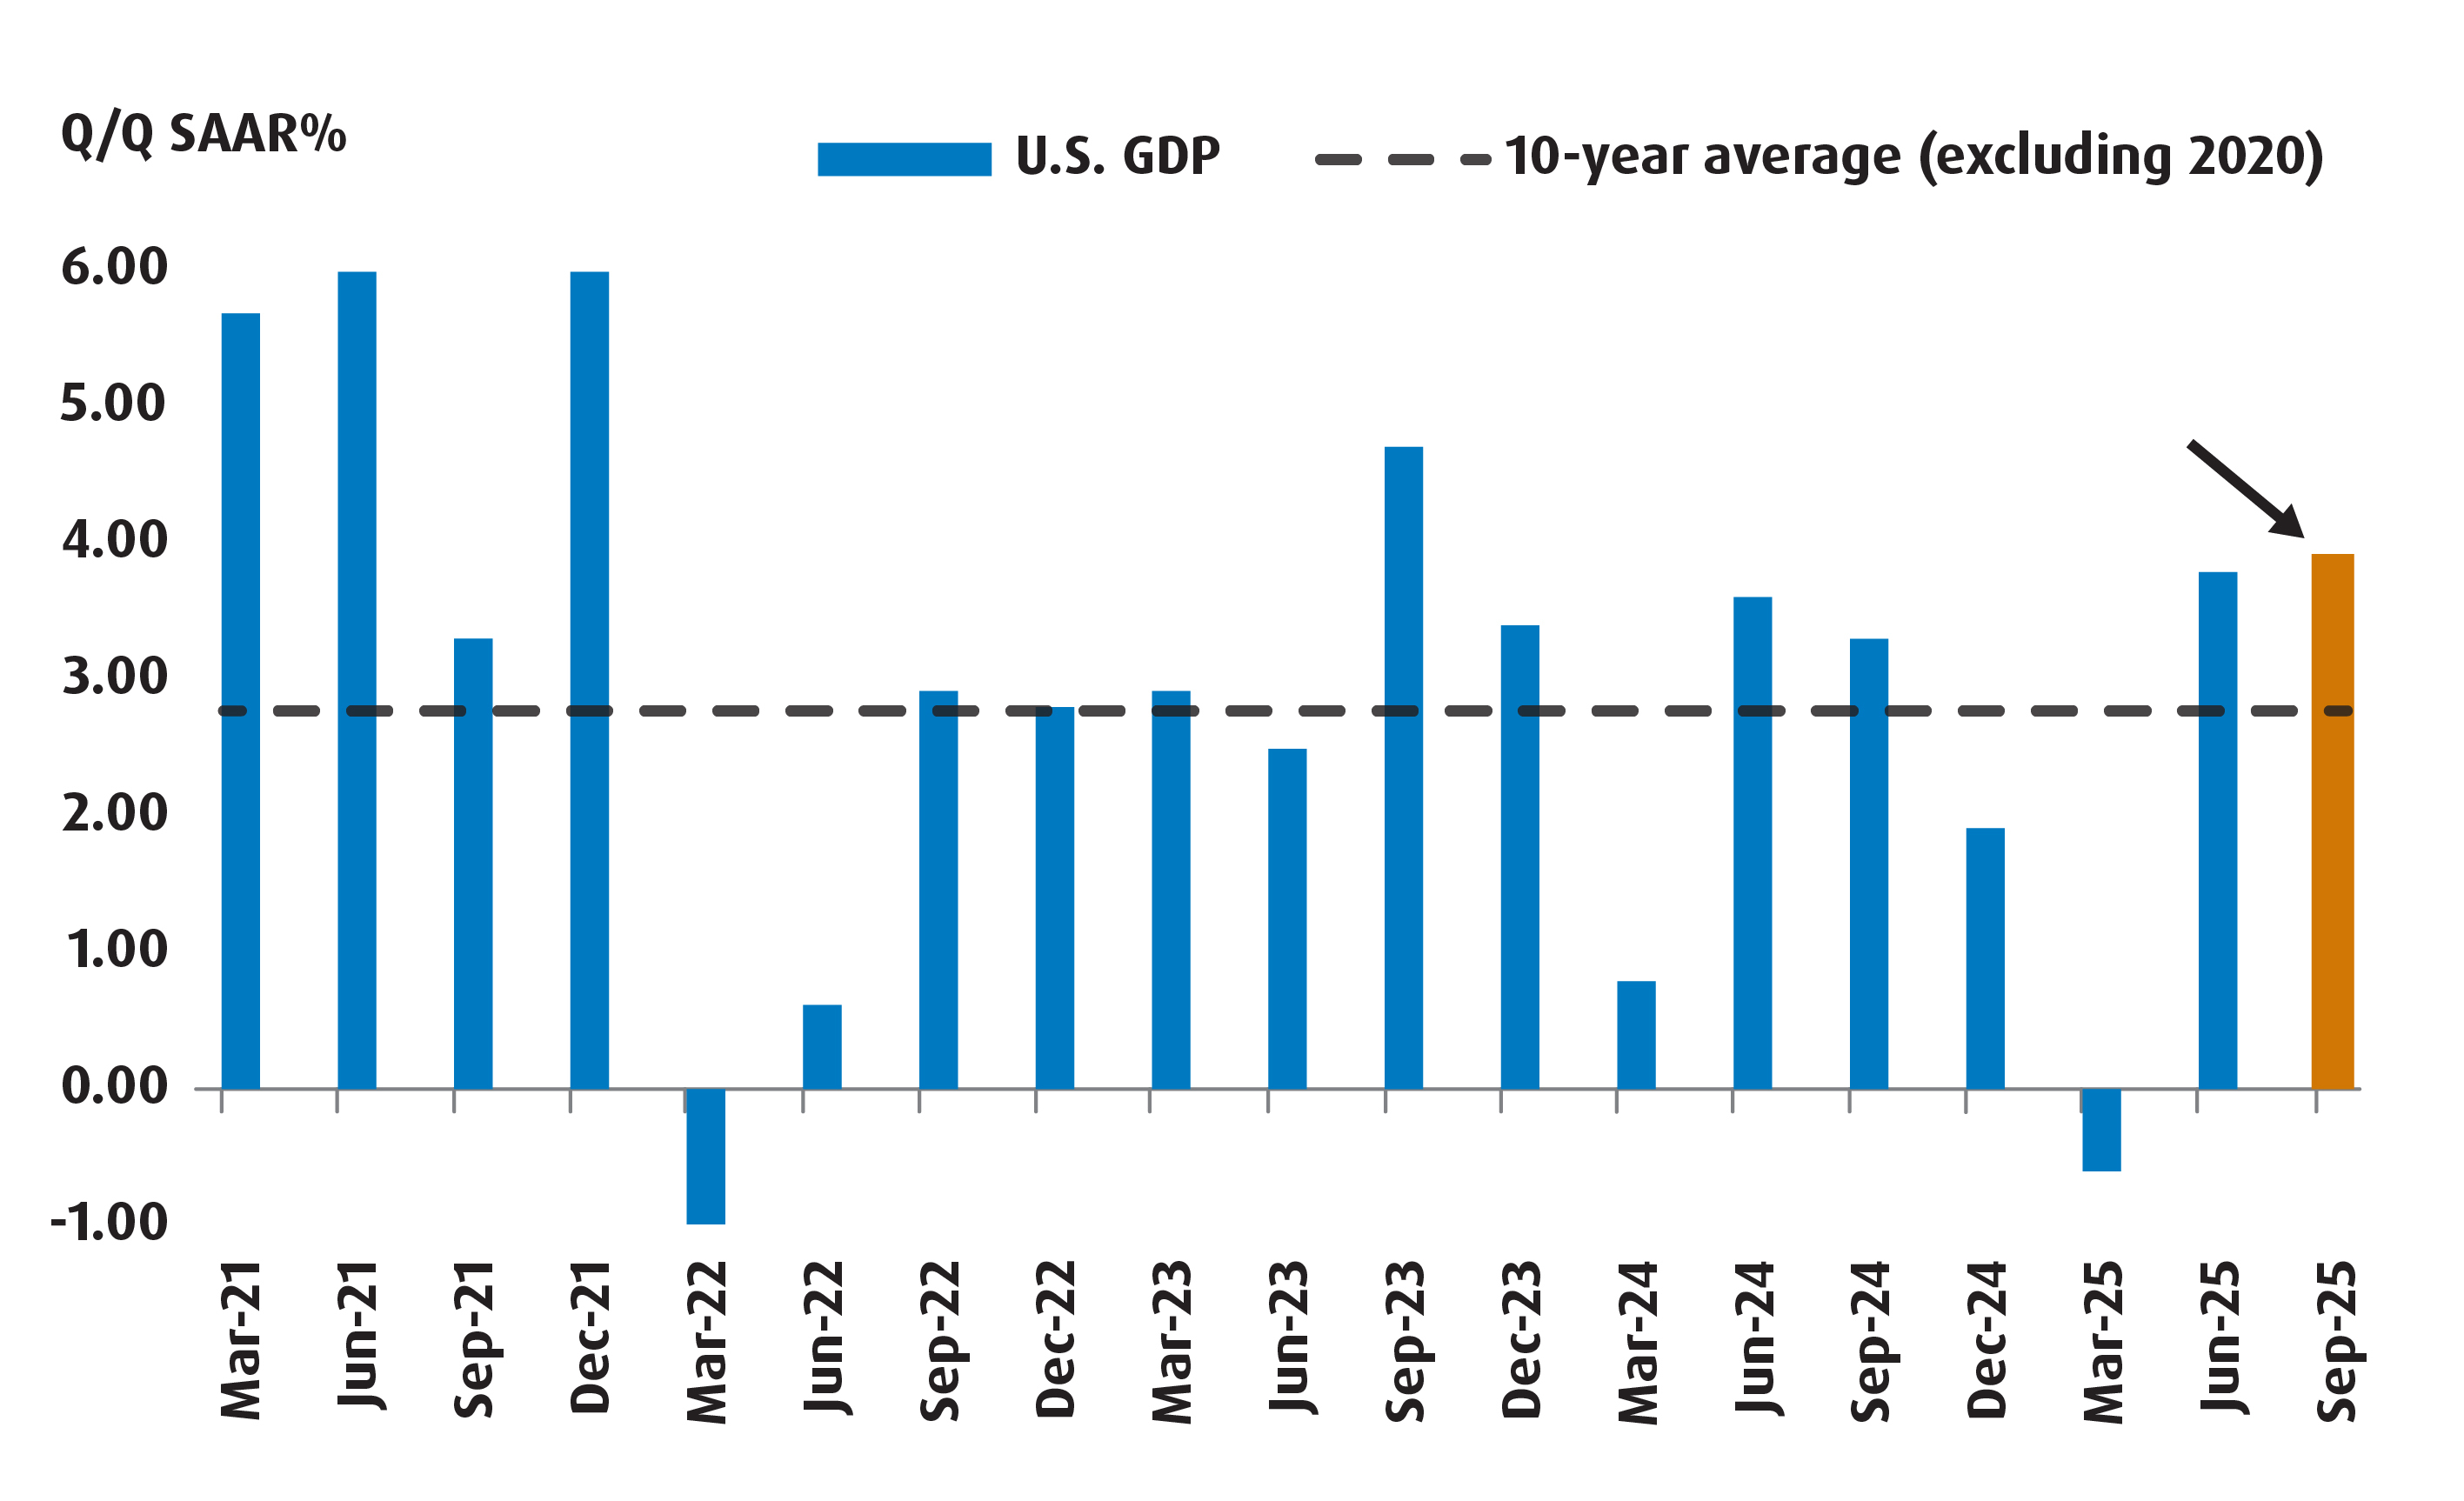
SAAR = seasonally adjusted annualized rate. Forecast is based on Atlanta Fed GDPNow Model estimate as of September 27, 2025.
For instance, the Federal Reserve (Fed) delivered on expectations of a 25 basis point (bps) cut in September largely because it judged that the balance of risks had shifted, and that the employment backdrop was deteriorating. That made sense given the massive revisions lower to nonfarm job gain estimates over the past few months, and also because of how subdued household sentiment has been of late. Indeed, the University of Michigan Consumer Sentiment Index has been falling over the past few months due (largely) to falling expectations for the economy.
But despite all of that, the hard data on real activity has been surprisingly strong. For instance, the final estimate for Q2 GDP came in at 3.8% on an annualized basis. That is well above what the first estimate had indicated (3.0%) and what many private sector economists had anticipated (3.3%). What’s more is that this revision was primarily driven by stronger than expected household consumption (revised higher from 1.4% to 2.5%).
To add to the surprise, we now have reputable ‘Nowcast’ models run by regional Fed banks that are telling us that the U.S. economy likely expanded by 3-4% again in Q3. That is also on the heels of a string of strong retail sales reports, as well – further proof that households are actively spending money on goods and services despite challenging job prospects and plummeting sentiment.
Clearly, there is an “invisible engine” that is working overtime to ensure that the economy (and markets) continue to hum. And in our minds, that engine is the massive amount of capital expenditures tied to AI-related projects.
We can see evidence of this in two ways:
- First, growth in key AI proxies within the GDP report (spending on software and research/development) have outpaced that of household consumption over the past four quarters (Chart 2).
- Second, the top-performing sectors since ‘Liberation Day’ (April 2) are Communications, Technology and Utilities. All three of them have been tied to the AI boom – and the resulting gains for portfolios have led to increased wealth for American households. In turn, that has engendered an increase in spending on goods and services among the wealthiest Americans.
Chart 2 – Average growth in key GDP categories over the past four quarters
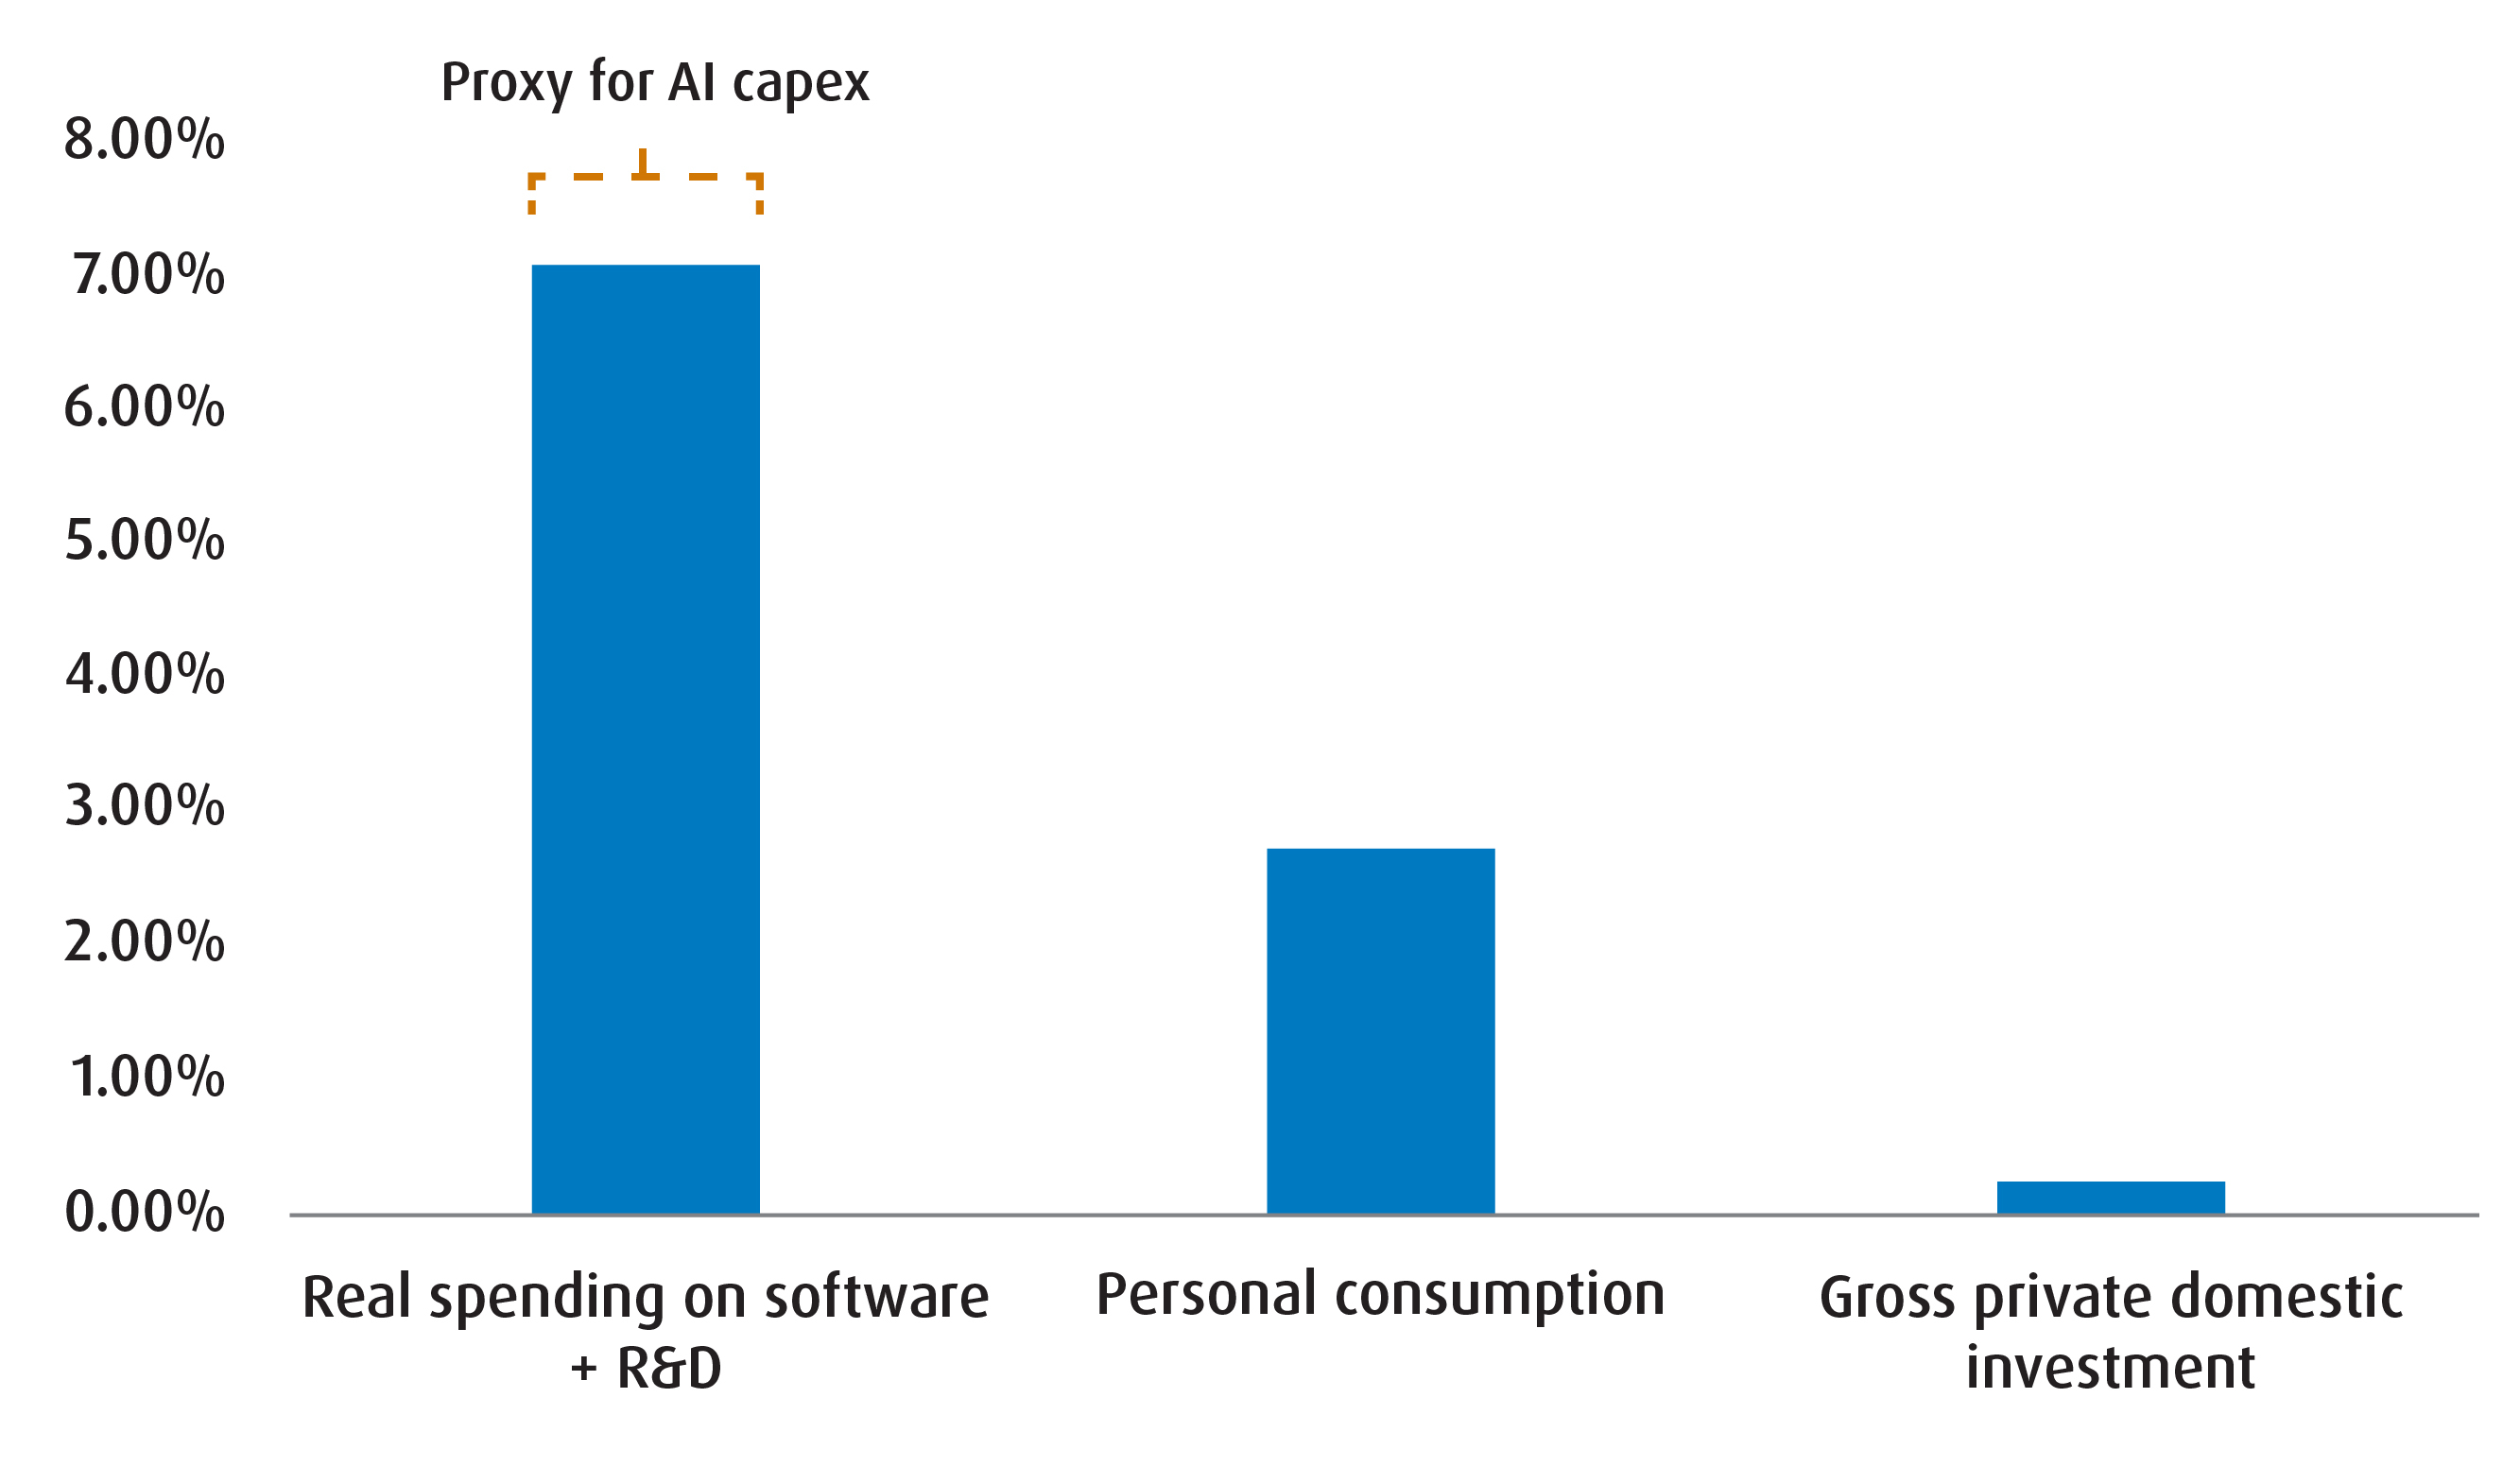
All the above tell us that the current AI boom is not just a market story – it’s an economic one too. That will have meaningful implications for our portfolios:
- For one, it tells us that while the economy outside of the AI-related space is slowing, the Fed will likely not ease by as much as the market is expecting. When taken with the term premium risks that we have highlighted in our other work, this suggests more headwinds than tailwinds for the sovereign fixed income space – regardless of what part of the curve we are talking about.
- Second, we are going to continue to lean into the AI story while also paying tribute to the fact that other parts of the economy are slowing to a degree. That means maintaining exposure to sectors that leverage AI spending whilst also prioritizing ‘Quality’ as a factor.
Indeed, our enthusiasm for Quality is borne out from our concern that the AI boom is masking weakness in other areas of the economy and the market. A “tighter for longer” Fed policy is an indication that the credit cycle should slow further. At the margin, that means that exposure to firms with strong balance sheets, low degree of leverage and stable cash flow is the optimal path to follow from here.
- Third (and indirectly related to the prior two implications), we see increased value in Gold and other alternative assets as diversifiers with upside. Indeed, there is now a whiff of retail/institutional investor enthusiasm for the precious metal relative to years past – when it was primarily central banks and macro investors driving the bus.
Heading into the home stretch of 2025, we are aligning our portfolios to take advantage of a mix of the above three implications. Unlike our hero Neo in the Matrix movies, we don’t have the benefit of knowing which reality is true at this point. Nevertheless, we’re still confident that our emphasis on AI, Quality and Gold leaves us in decent shape to dodge any market-related bullets (slow motion or not).
Balanced Portfolio for Q4 2025
Investment Objective and Strategy:
The strategy involves tactically allocating to multiple asset-classes and geographies to achieve long-term capital appreciation and total return by investing primarily in ETFs
| Ticker | ETF Name | Sector | Positioning | Price | Management Fee | Weight (%) | 90-Day Volatility | Volatility Contribution | Annualized Distribution Yield (%)* | Yield/Volatility** |
|---|---|---|---|---|---|---|---|---|---|---|
| Fixed Income | ||||||||||
| ZDB | BMO Discount Bond Index ETF | Fixed Income | Core | $15.21 | 0.09% | 5.0% | 4.16% | 2.26% | 2.36% | 0.57 |
| ZBI | BMO Canadian Bank Income Index ETF | Fixed Income | Core | $31.05 | 0.25% | 10.0% | 2.59% | 2.82% | 4.13% | 1.59 |
| ZUCM.U | BMO USD Cash Management ETF (USD Units) | Fixed Income | Tactical | $30.08 | 0.12% | 5.0% | 1.25% | 0.68% | 4.15% | 3.32 |
| Total Fixed Income | 20.0% | 5.77% | ||||||||
| Equities | ||||||||||
| ZUQ | BMO MSCI USA High Quality Index ETF | Equity | Core | $93.87 | 0.30% | 20.00% | 10.76% | 23.45% | 0.47% | 0.04 |
| ZCN | BMO S&P/TSX Capped Composite Index ETF | Equity | Core | $39.96 | 0.05% | 17.00% | 7.96% | 14.74% | 2.30% | 0.29 |
| ZIQ | BMO MSCI EAFE High Quality Index ETF | Equity | Tactical | $31.71 | 0.35% | 12.00% | 13.27% | 17.35% | 0.00 | |
| ZXLU.F | BMO SPDR Utilities Select Sector Index ETF (CAD Hedged) | Equity | Tactical | $32.97 | 0.19% | 5.00% | 12.92% | 7.04% | 0.00 | |
| ZEM | BMO MSCI Emerging Markets Index ETF | Equity | Tactical | $26.57 | 0.25% | 10.00% | 11.46% | 12.48% | 2.08% | 0.18 |
| Total Equity | 64.0% | 75.06% | ||||||||
| Non-Traditional Hybrids | ||||||||||
| ZLSC | BMO Long Short Canadian Equity ETF | Hybrid | Tactical | $41.53 | 0.65% | 4.00% | 5.99% | 2.61% | 1.53% | 0.26 |
| ZWGD | BMO Covered Call Spread Gold Bullion ETF | Hybrid | Tactical | $33.36 | 0.65% | 10.00% | 13.02% | 14.18% | 0.00 | |
| ZGI | BMO Global Infrastructure Index ETF | Hybrid | Tactical | $52.94 | 0.55% | 2.00% | 10.93% | 2.38% | 2.67% | 0.24 |
| Total Alternatives | 16.00% | 19.17% | ||||||||
| Total Cash | 0.00% | 0.00% | ||||||||
| Portfolio | 0.28% | 100.0% | 9.18% | 100.0% | 1.55% | 0.17 | ||||
As of September 30, 2025. Model portfolio for illustrative purposes only. The information contained herein is not, and should not be construed as, investment, tax or legal advice to any party. These are not recommendations to buy or sell any particular security. Particular investments and/or trading strategies should be evaluated relative to the individual’s investment objectives and professional advice should be obtained with respect to any circumstance.
* The Annualized Distribution Yield is calculated by taking the most recent regular distribution, or expected distribution, (excluding additional year end distributions) annualized for frequency, divided by current NAV. The yield calculation does not include reinvested distributions.
Yield calculations for bonds are based on yield to maturity, including coupon payments and any capital gain or loss that the investor will realize by holding the bonds to maturity and. For equities, it is based on the most recent annualized income received divided by the market value of the investments. Please note yields of equities will change from month to month based on market conditions.
Changes to the balanced portfolio from Q3 2025
Sell/Trim |
Ticker |
Old weight |
(%) Change |
New weight |
5% |
-5% |
0% |
||
15% |
-15% |
0% |
||
15% |
-15% |
0% |
||
6% |
-6% |
0% |
||
5% |
-5% |
0% |
||
5% |
-1% |
4% |
||
5% |
-3% |
2% |
Buy/Add |
Ticker |
Old weight |
% Change |
New weight |
0% |
5% |
5% |
||
15% |
5% |
20% |
||
0% |
17% |
17% |
||
0% |
12% |
12% |
||
0% |
5% |
5% |
||
9% |
1% |
10% |
||
5% |
5% |
10% |
As of September 30, 2025. Model portfolio for illustrative purposes only. The information contained herein is not, and should not be construed as, investment, tax or legal advice to any party. These are not recommendations to buy or sell any particular security. Particular investments and/or trading strategies should be evaluated relative to the individual’s investment objectives and professional advice should be obtained with respect to any circumstance.
Asset Allocation:
- We are shifting our equity tilt slightly. Compared to Q3, we are now modestly overweight and increasing the allocation to 64% from our benchmark 60%. Again, we feel this is justified given the still constructive fundamentals in the U.S., and to a lesser degree, Canada.
- Much like last quarter, we remain underweight fixed income relative to our benchmark (20% versus 30%).
- In the developed markets, most central banks are either close to, or at the end of their easing cycles. That leaves little impetus for upside in the front-end (including for the Bank of Canada). Meanwhile, the Bank of Japan is the sole developed market central bank that is still in the midst of a hiking cycle (which is bearish for the front-end of the JPY curve). In the U.S., there is already an aggressive easing profile priced in for the Fed.
- Further out the curve, there is still the risk of rising term premiums from increased supply. In our minds, rates need to get to a higher level before we would gauge them as ‘cheap enough’ to establish fresh longs.
- In the alts/hybrid sleeve, we remain overweight relative to our benchmark but are curbing our exposure slightly.
Equities
- Within the equity sleeve, we are pivoting towards Quality as a factor and exposure to AI as a theme. For instance, in the US, we are increasing our core position in ZUQ (BMO MSCI USA High Quality Index ETF) while establishing a long position in the Utilities sector via ZXLU.F (or the BMO SPDR Utilities Select Sector Index ETF – Hedged-to-CAD). The added benefit of increasing our exposure to ZUQ means that we’ll also increase our exposure to sectors that are best positioned to capitalize on AI-related themes as well (Tech and Communications).
- For our Canadian exposure, we have elected to switch out of ZLB (BMO Low Volatility Canadian Equity ETF) and into ZCN (BMO S&P/TSX Capped Composite Index ETF). The reason? The latter gives us more exposure into sectors that should continue to perform (Materials and Financials). Materials, in particular, is well placed given the more diversified exposure to gold miners.
- We have also made the decision to exit out of our position in ZLI (BMO Low Volatility International Equity ETF) and opted for ZIQ (BMO MSCI EAFE High Quality Index ETF). With trade tensions now receding into the backdrop, we feel that Quality should outperform as a factor as opposed to Low Vol.
- We have increased our position in ZEM (BMO MSCI Emerging Markets Index ETF) slightly. At the same time, we are cutting our positions in ZIN (BMO Equal Weight Industrials Index ETF).
Fixed Income
- Relative to our Q3 portfolio, we are keeping our exposures the same for ZDB (BMO Discount Bond Index ETF) and for ZBI (BMO Canadian Bank Income Index ETF).
- We are switching out of our long position in ZTS (BMO Short-Term US Treasury Bond Index ETF) for ZUCM.U (BMO USD Cash Management ETF in USD Units).
- The reason for that switch is that we feel that US rates (even in the front-end) remain vulnerable as US fundamentals remain strong. As such, we like the ultra-short end of the curve to play any further Fed rate cuts.
Alts/hybrids
- We are increasing our allocation to ZWGD (BMO Covered Call Spread Gold Bullion ETF) to take advantage of what we feel is the start of another leg higher in Gold.
- Given the anticipated decline in uncertainty, we are cutting our exposure to ZLSU (BMO Long Short US Equity ETF) and making a slight tweak to our holding in ZLSC (BMO Long Short Canadian Equity ETF). We are also curbing our exposure to ZGI (BMO Global Infrastructure Index ETF).
Fund Performance (%)
Ticker |
Year-to-date |
1-month |
3-month |
6-month |
1-year |
3-year |
5-year |
10-year |
Since inception |
Inception date |
17.51% |
4.95% |
9.81% |
14.04% |
25.76% |
17.40% |
14.92% |
10.79% |
9.06% |
2009-05-29 |
|
15.02% |
1.36% |
10.86% |
11.78% |
18.67% |
12.10% |
5.97% |
7.05% |
5.32% |
2009-10-20 |
|
2.85% |
1.22% |
6.59% |
-0.78% |
9.89% |
22.94% |
14.56% |
15.75% |
16.16% |
2014-11-05 |
|
0.88% |
0.32% |
-0.48% |
-1.37% |
2.71% |
3.74% |
-0.59% |
1.65% |
2.22% |
2014-02-10 |
|
2.57% |
-0.05% |
0.26% |
-0.83% |
10.93% |
7.73% |
11.13% |
8.00% |
11.35% |
2010-01-19 |
|
Returns are not available as there is less than one year’s performance data. |
2024-10-24 |
|||||||||
3.55% |
0.53% |
1.71% |
2.18% |
6.87% |
6.53% |
— |
— |
4.03% |
2022-02-07 |
|
2.81% |
0.37% |
1.06% |
2.10% |
4.41% |
— |
— |
— |
4.91% |
2023-09-27 |
|
13.25% |
1.78% |
5.79% |
13.20% |
19.98% |
— |
— |
— |
20.61% |
2023-09-27 |
|
Returns are not available as there is less than one year’s performance data. |
2025-02-04 |
|||||||||
Returns are not available as there is less than one year’s performance data. |
2025-05-22 |
|||||||||
Bloomberg, as of September 30, 2025.
Portfolio Characteristics
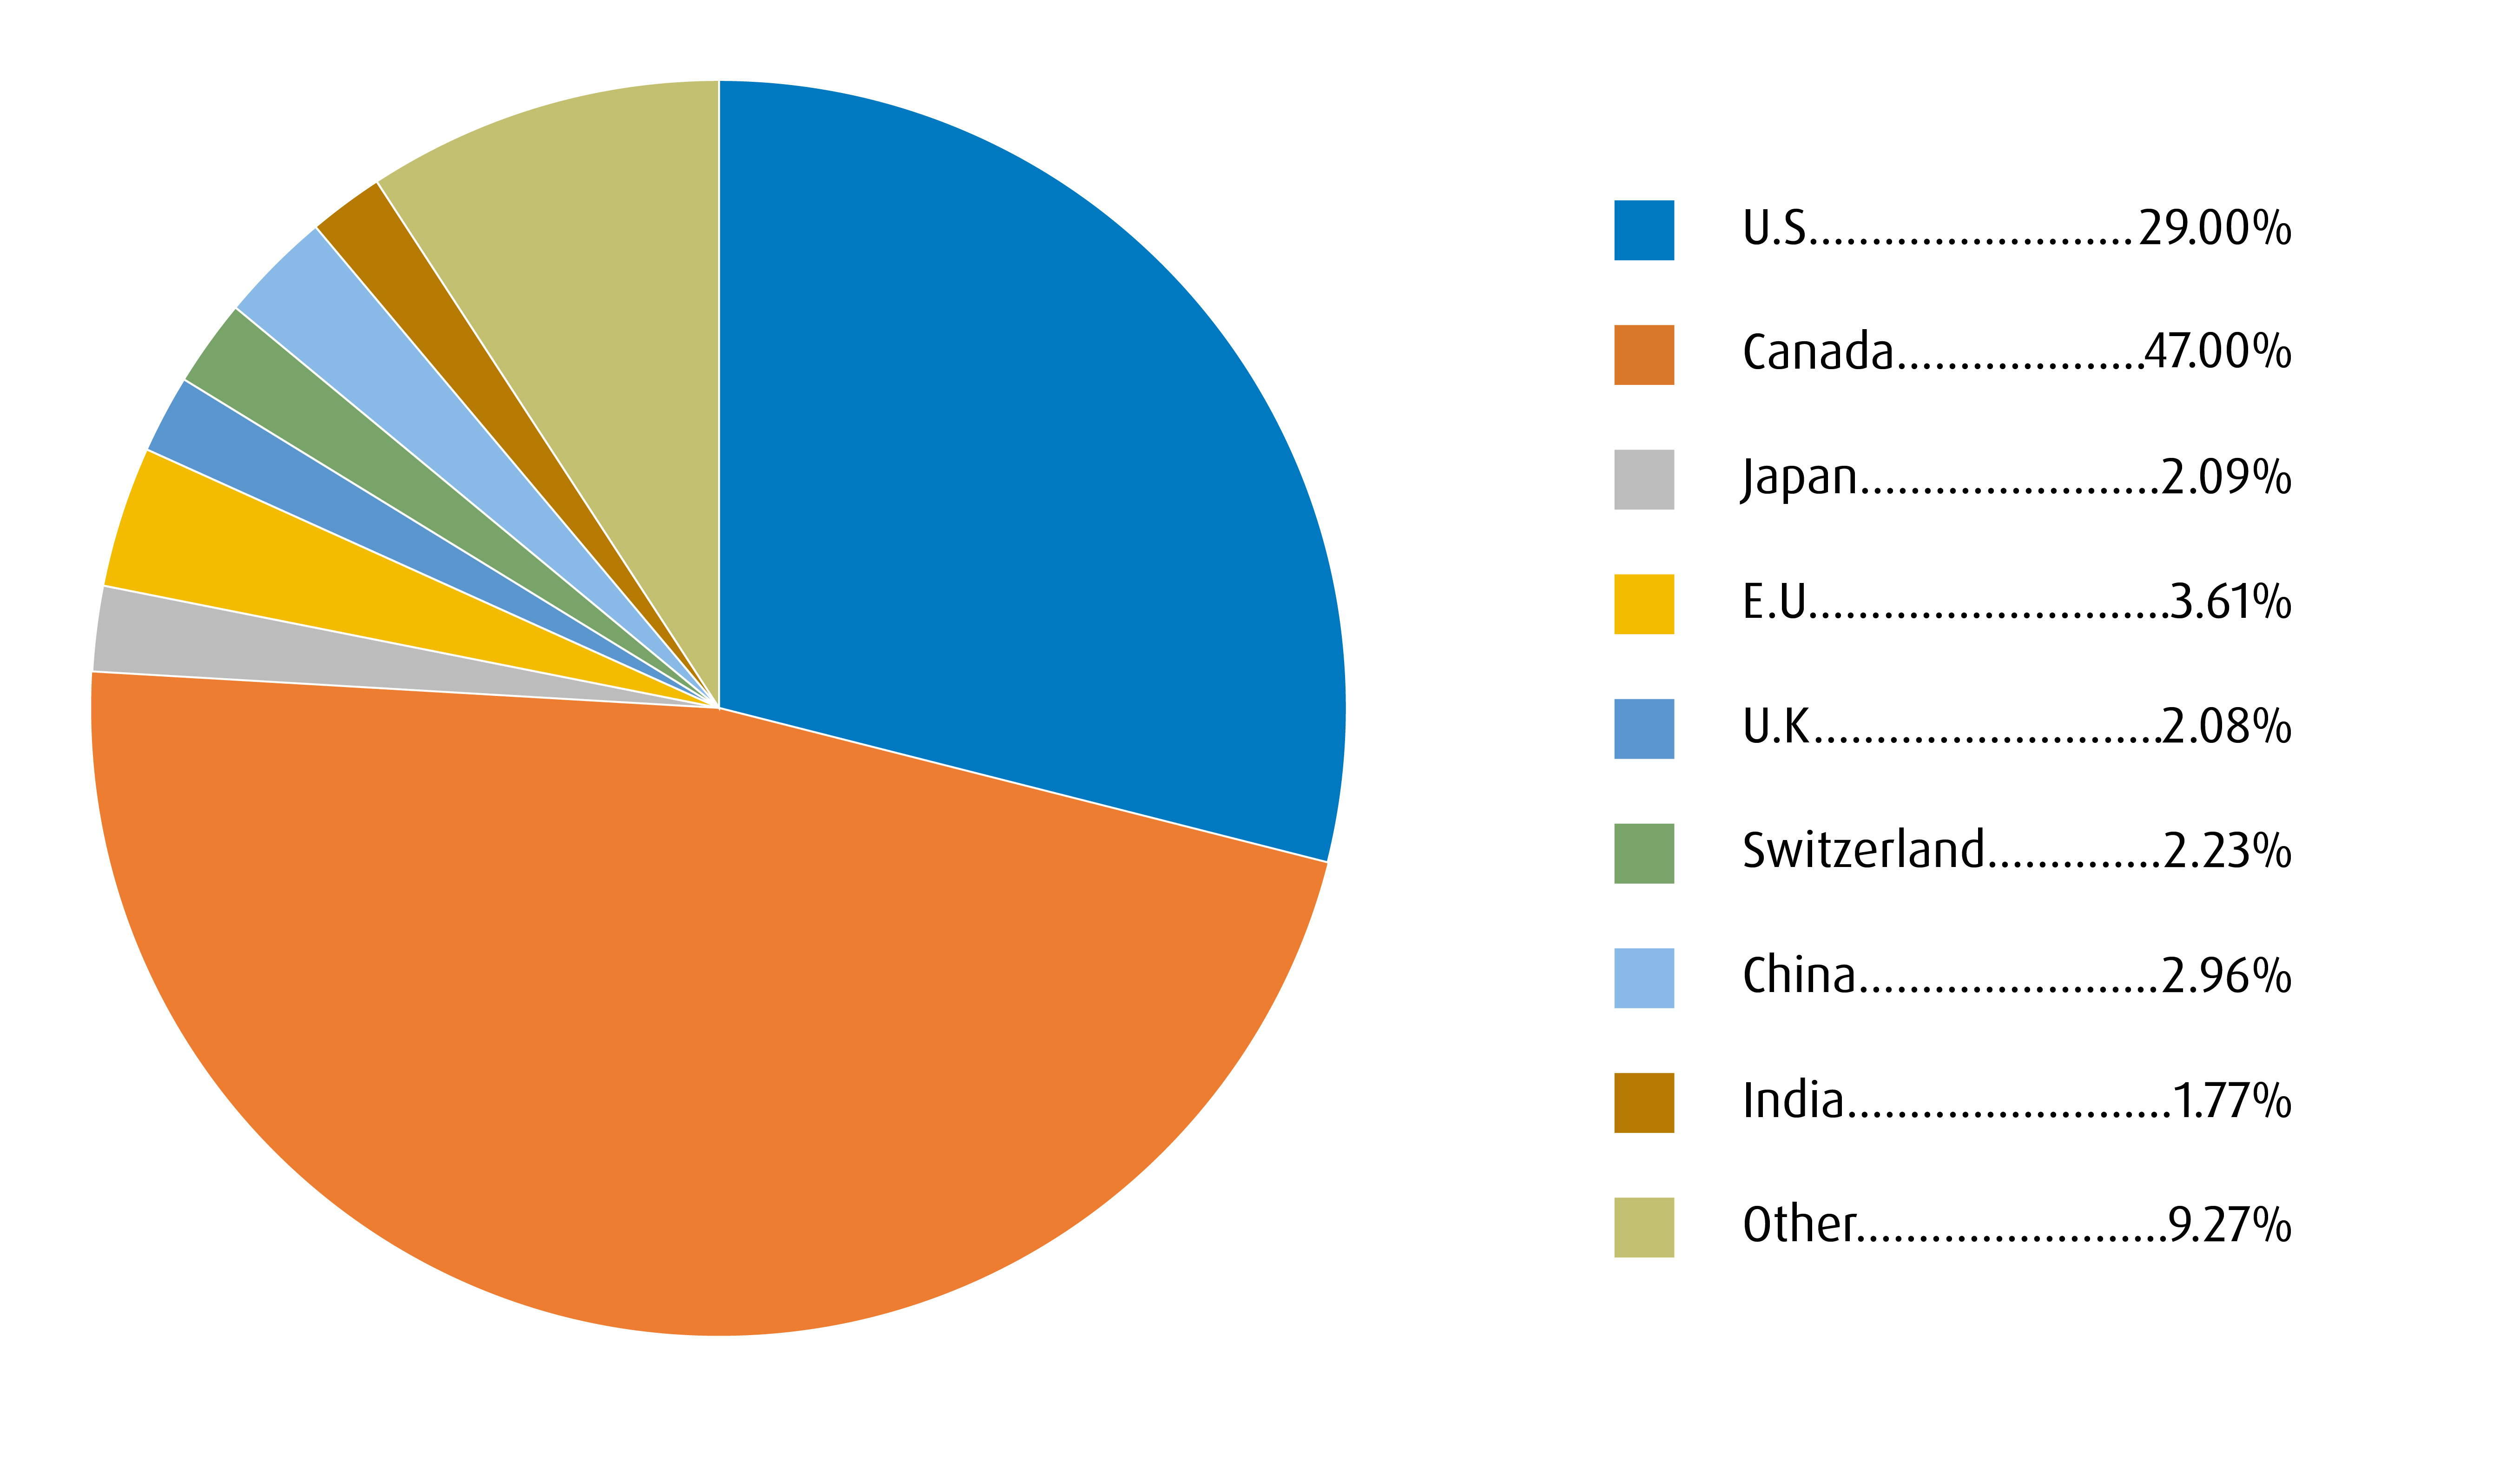
Regional breakdown
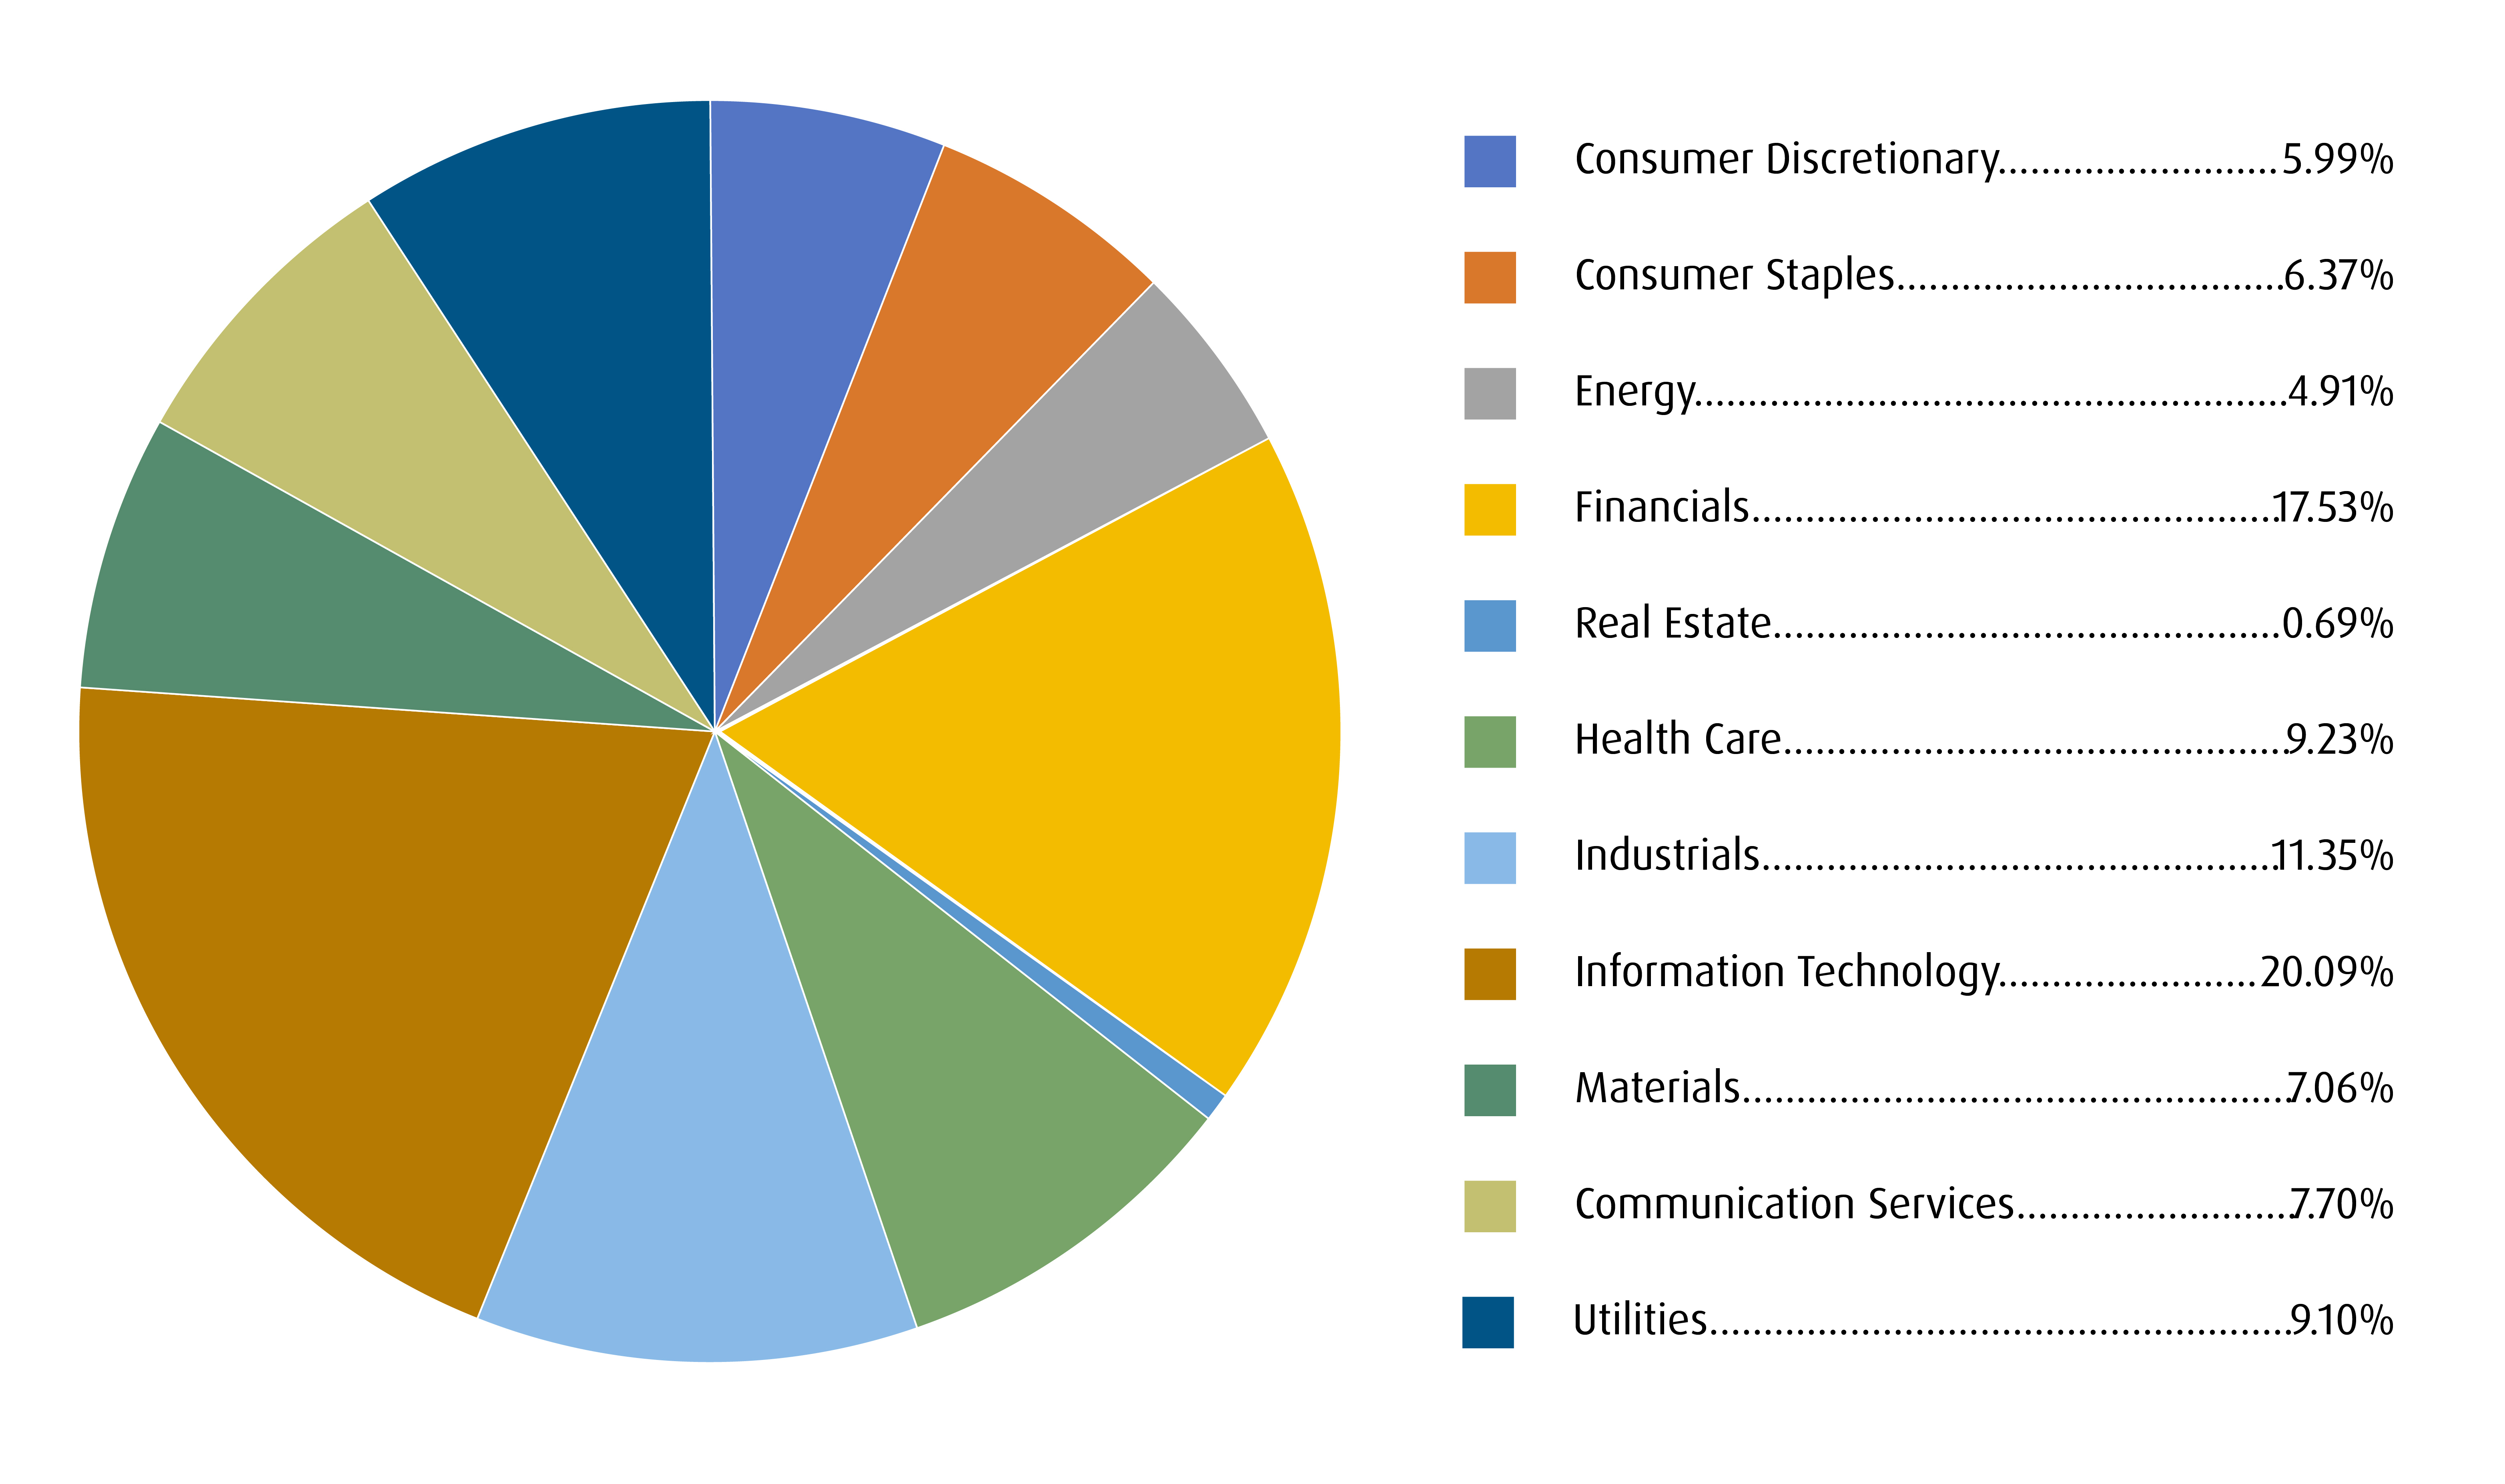
Sector breakdown
Fixed Income breakdown
Federal |
10.4% |
Weighted Average Term |
3.43 |
Provincial |
8.0% |
Weighted Average Duration |
2.76 |
Corporate |
56.2% |
Weighted Average Coupon (%) |
2.77 |
Municipal |
0.3% |
Annualized Dist. Yield (%) |
2.66 |
Weighted Average Yield to Maturity (%) |
2.59 |
Source: BMO Global Asset Management. Model portfolio for illustrative purposes only. As of September 30, 2025.
Visit bmo.com/etfs or contact Client Services at 1−800−361−1392.
To listen to our Views From the Desk BMO ETF Podcasts, please visit bmoetfs.ca.
BMO ETF Podcasts are also available on


Disclaimers
For advisor use only.
The portfolio holdings and asset allocations are subject to change without notice and individual holdings only represent a small percentage of portfolio holdings. They are not recommendations to buy or sell any particular security.
Any statement that necessarily depends on future events may be a forward-looking statement. Forward-looking statements are not guarantees of performance. They involve risks, uncertainties and assumptions. Although such statements are based on assumptions that are believed to be reasonable, there can be no assurance that actual results will not differ materially from expectations. Investors are cautioned not to rely unduly on any forward-looking statements. In connection with any forward-looking statements, investors should carefully consider the areas of risk described in the most recent prospectus.
The viewpoints expressed by the author represents their assessment of the markets at the time of publication. Those views are subject to change without notice at any time. The information provided herein does not constitute a solicitation of an offer to buy, or an offer to sell securities nor should the information be relied upon as investment advice. Past performance is no guarantee of future results.
This communication is for information purposes. The information contained herein is not, and should not be construed as, investment, tax or legal advice to any party. Particular investments and/or trading strategies should be evaluated relative to the individual’s investment objectives and professional advice should be obtained with respect to any circumstance.
Index returns do not reflect transactions costs or the deduction of other fees and expenses and it is not possible to invest directly in an Index. Past performance is not indicative of future results.
The ETFs referred to herein are not sponsored, endorsed, or promoted by MSCI and MSCI bear no liability with respect to an ETF or any index on which such ETF is based. The ETF’s prospectus contains a more detailed description of the limited relationship that MSCI has with the Manager and any related ETF.
The Index is a product of S&P Dow Jones Indices LLC or its affiliates (“SPDJI”), and has been licensed for use by the Manager. S&P®, S&P 500®, US 500, The 500, iBoxx®, iTraxx® and CDX® are trademarks of S&P Global, Inc. or its affiliates (“S&P”) and Dow Jones® is a registered trademark of Dow Jones Trademark Holdings LLC (“Dow Jones”), and these trademarks have been licensed for use by SPDJI and sublicensed for certain purposes by the Manager. The ETF is not sponsored, endorsed, sold or promoted by SPDJI, Dow Jones, S&P, their respective affiliates, and none of such parties make any representation regarding the advisability of investing in such product(s) nor do they have any liability for any errors, omissions, or interruptions of the Index.
The Select Sector SPDR Trust consists of eleven separate investment portfolios (each a “Select Sector SPDR ETF” or an “ETF” and collectively the “Select Sector SPDR ETFs” or the “ETFs”). Each Select Sector SPDR ETF is an “index fund” that invests in a particular sector or group of industries represented by a specified Select Sector Index. The companies included in each Select Sector Index are selected on the basis of general industry classification from a universe of companies defined by the S&P 500®. The investment objective of each ETF is to provide investment results that, before expenses, correspond generally to the price and yield performance of publicly traded equity securities of companies in a particular sector or group of industries, as represented by a specified market sector index.
The S&P 500, SPDRs, and Select Sector SPDRs are trademarks of The McGraw-Hill Companies, Inc. and have been licensed for use. The stocks included in each Select Sector Index were selected by the compilation agent. Their composition and weighting can be expected to differ to that in any similar indexes that are published by S&P. The S&P 500 Index is an unmanaged index of 500 common stocks that is generally considered representative of the U.S. stock market. The index is heavily weighted toward stocks with large market capitalizations and represents approximately two-thirds of the total market value of all domestic common stocks. The S&P 500 Index figures do not reflect any fees, expenses or taxes. An investor should consider investment objectives, risks, fees and expenses before investing.
You cannot invest directly in an index.
Commissions, management fees and expenses all may be associated with investments in exchange-traded funds. Please read the ETF Facts or prospectus of the BMO ETFs before investing. The indicated rates of return are the historical annual compounded total returns including changes in unit value and reinvestment of all dividends or distributions and do not take into account sales, redemption, distribution or optional charges or income taxes payable by any unitholder that would have reduced returns. Exchange-traded funds are not guaranteed, their values change frequently and past performance may not be repeated.
For a summary of the risks of an investment in the BMO ETFs, please see the specific risks set out in the BMO ETF’s prospectus. BMO ETFs trade like stocks, fluctuate in market value and may trade at a discount to their net asset value, which may increase the risk of loss. Distributions are not guaranteed and are subject to change and/or elimination.
Distribution yields are calculated by using the most recent regular distribution, or expected distribution, (which may be based on income, dividends, return of capital, and option premiums, as applicable) and excluding additional year end distributions, and special reinvested distributions annualized for frequency, divided by current net asset value (NAV). The yield calculation does not include reinvested distributions. Distributions are not guaranteed, may fluctuate and are subject to change and/or elimination. Distribution rates may change without notice (up or down) depending on market conditions and NAV fluctuations. The payment of distributions should not be confused with the BMO ETF’s performance, rate of return or yield. If distributions paid by a BMO ETF are greater than the performance of the investment fund, your original investment will shrink. Distributions paid as a result of capital gains realized by a BMO ETF, and income and dividends earned by a BMO ETF, are taxable in your hands in the year they are paid. Your adjusted cost base will be reduced by the amount of any returns of capital. If your adjusted cost base goes below zero, you will have to pay capital gains tax on the amount below zero.
Cash distributions, if any, on units of a BMO ETF (other than accumulating units or units subject to a distribution reinvestment plan) are expected to be paid primarily out of dividends or distributions, and other income or gains, received by the BMO ETF less the expenses of the BMO ETF, but may also consist of non-taxable amounts including returns of capital, which may be paid in the manager’s sole discretion. To the extent that the expenses of a BMO ETF exceed the income generated by such BMO ETF in any given month, quarter, or year, as the case may be, it is not expected that a monthly, quarterly, or annual distribution will be paid. Distributions, if any, in respect of the accumulating units of BMO Short Corporate Bond Index ETF, BMO Short Federal Bond Index ETF, BMO Short Provincial Bond Index ETF, BMO Ultra Short-Term Bond ETF and BMO Ultra Short-Term US Bond ETF will be automatically reinvested in additional accumulating units of the applicable BMO ETF. Following each distribution, the number of accumulating units of the applicable BMO ETF will be immediately consolidated so that the number of outstanding accumulating units of the applicable BMO ETF will be the same as the number of outstanding accumulating units before the distribution. Non-resident unitholders may have the number of securities reduced due to withholding tax. Certain BMO ETFs have adopted a distribution reinvestment plan, which provides that a unitholder may elect to automatically reinvest all cash distributions paid on units held by that unitholder in additional units of the applicable BMO ETF in accordance with the terms of the distribution reinvestment plan. For further information, see the distribution policy in the BMO ETFs’ prospectus.
BMO ETFs are managed and administered by BMO Asset Management Inc., an investment fund manager and a portfolio manager, and a separate legal entity from Bank of Montreal.
BMO Global Asset Management is a brand name under which BMO Asset Management Inc. and BMO Investments Inc. operate.
“BMO (M-bar roundel symbol)” is a registered trademark of Bank of Montreal, used under licence.