How to Forecast S&P 500 Earnings Using Macro Inputs
A deep dive into the methodology behind our earnings model for U.S. sectors, determining where optimism looks stretched and which sectors are positioned to outperform.


For this note, we’re setting out to do three things:
- Demonstrate how to use select macro variables to forecast S&P 500 earnings growth for end-2026.
- Use the projected earnings growth to forecast those for each of the GICs sectors.
- Highlight which sectors are undervalued on a forward price-to-earnings ratio (P/E) basis.
Of course, there are several different ways to forecast S&P 500 earnings. Equity analysts will generally use a mix of bottom-up metrics to varying degrees. But in our role as macro analysts, we tend to put more of an emphasis on top-down variables. In particular, we rely on three important U.S. economic data points.
The first is the U.S. Consumer Price Index (CPI) – which tends to move pro-cyclically with earnings. Recall, that earnings are reported in nominal terms (meaning that they’re not adjusted for inflation). So, when CPI rises, the prices that firms charge should also increase to maintain margins. Additionally, including this variable pays tribute to the fact that prices will often adapt much quicker to economic realities than costs will (i.e., labour). CPI impacts earnings via the price channel.
The second is the unemployment rate – which is an indicator of where we are in the business cycle and tends to move inversely with earnings growth. To illustrate, remember that the unemployment rate can be framed as a demand indicator. When it rises, consumers will typically cut discretionary spending which leads to slower volumes for businesses. When it falls, consumers will more likely ramp up spending leading to increased business volumes. The unemployment rate impacts earnings via the volume channel.
The third is the Institute for Supply Management (ISM) sentiment gauge – which gives us a sense of the breadth of business optimism and earnings. Our preference is to use a variation of the index compiled by Bloomberg, which weighs the contribution from the manufacturing and services sector based on their relative size in the economy. Simply put, when the ISM gauge is above 50 and increasing, more firms are likely to be expanding activity. Indeed, breadth improvement is often a lead indicator for earnings expansion (and vice versa).
We can take the year-over-year changes in each of the above variables and regress them against S&P 500 earnings growth. This rudimentary model has a reasonably tight fit (r-square value of 0.75), which tells us that the combination of the three does offer some predictive value for earnings growth. In Table 1, we use the relationships from our model to look at two hypothetical scenarios for where things could go by the end of this year, and what the corresponding growth for earnings looks like. For instance, under a recession scenario where inflation declines and the unemployment rate rises, our model would suggest earnings would drop by 11.3%. Conversely, if the economy continues to grow, we’d expect upside pressures to inflation to persist while the unemployment rate could drop to a degree.
A reasonable base case here would be for earnings to increase by 15.6%. What Table 1 also tells us is that if we assume there will be no changes to any of the three variables by the end of the year, then a reasonable expectation for earnings growth is around 10% (which is just below what the market is expecting).
Table 1 – Projected S&P 500 Earnings Growth Under Our Model
Scenario 1 (Recession) |
Scenario 2 (Continued Expansion) |
Current Levels |
|
Inflation |
1.50% |
3.00% |
2.70% |
Unemployment Rate |
5.50% |
4.10% |
4.40% |
ISM Composite |
45 |
56 |
53.8 |
Expected Earnings Growth |
-11.31% |
15.61% |
10.15% |
Source: BMO Global Asset Management, as of January 19, 2026.
From here, we can use the long-term relationships (or regressions) between S&P 500 and each sector to project earnings growth for the latter. Keeping things simple, let’s assume that the current values remain unchanged for our three macro variables. Table 2 shows us what we should expect for earnings growth for each sector under this scenario relative to what the market is expecting. From here, we can see that sectors like Materials, Consumer Discretionary, Health Care and Financials could outperform relative to street estimates (note that we’re overweight Financials and Health Care in our sector portfolio). Conversely, there’s reason to believe that sectors like Tech, Communications Services, Energy and Utilities could underwhelm.
Table 2 – Earnings Estimates: Model output using current levels for macro variables vs Market expectations
| Model Output (under current scenario) | Market expectations | |
| S&P 500 | 10.15% | 13.71% |
| Tech | 20.07% | 28.63% |
| Communications | 1.00% | 9.32% |
| Energy | -9.65% | 3.87% |
| Materials | 21.02% | 19.44% |
| Discretionary | 12.66% | 10.64% |
| Staples | 5.69% | 5.69% |
| Industrials | 8.99% | 14.16% |
| Healthcare | 9.38% | 6.19% |
| Utilities | 3.77% | 11.05% |
| Financials | 18.16% | 7.17% |
| Real Estate | 3.28% | 5.95% |
Source: BMO Global Asset Management
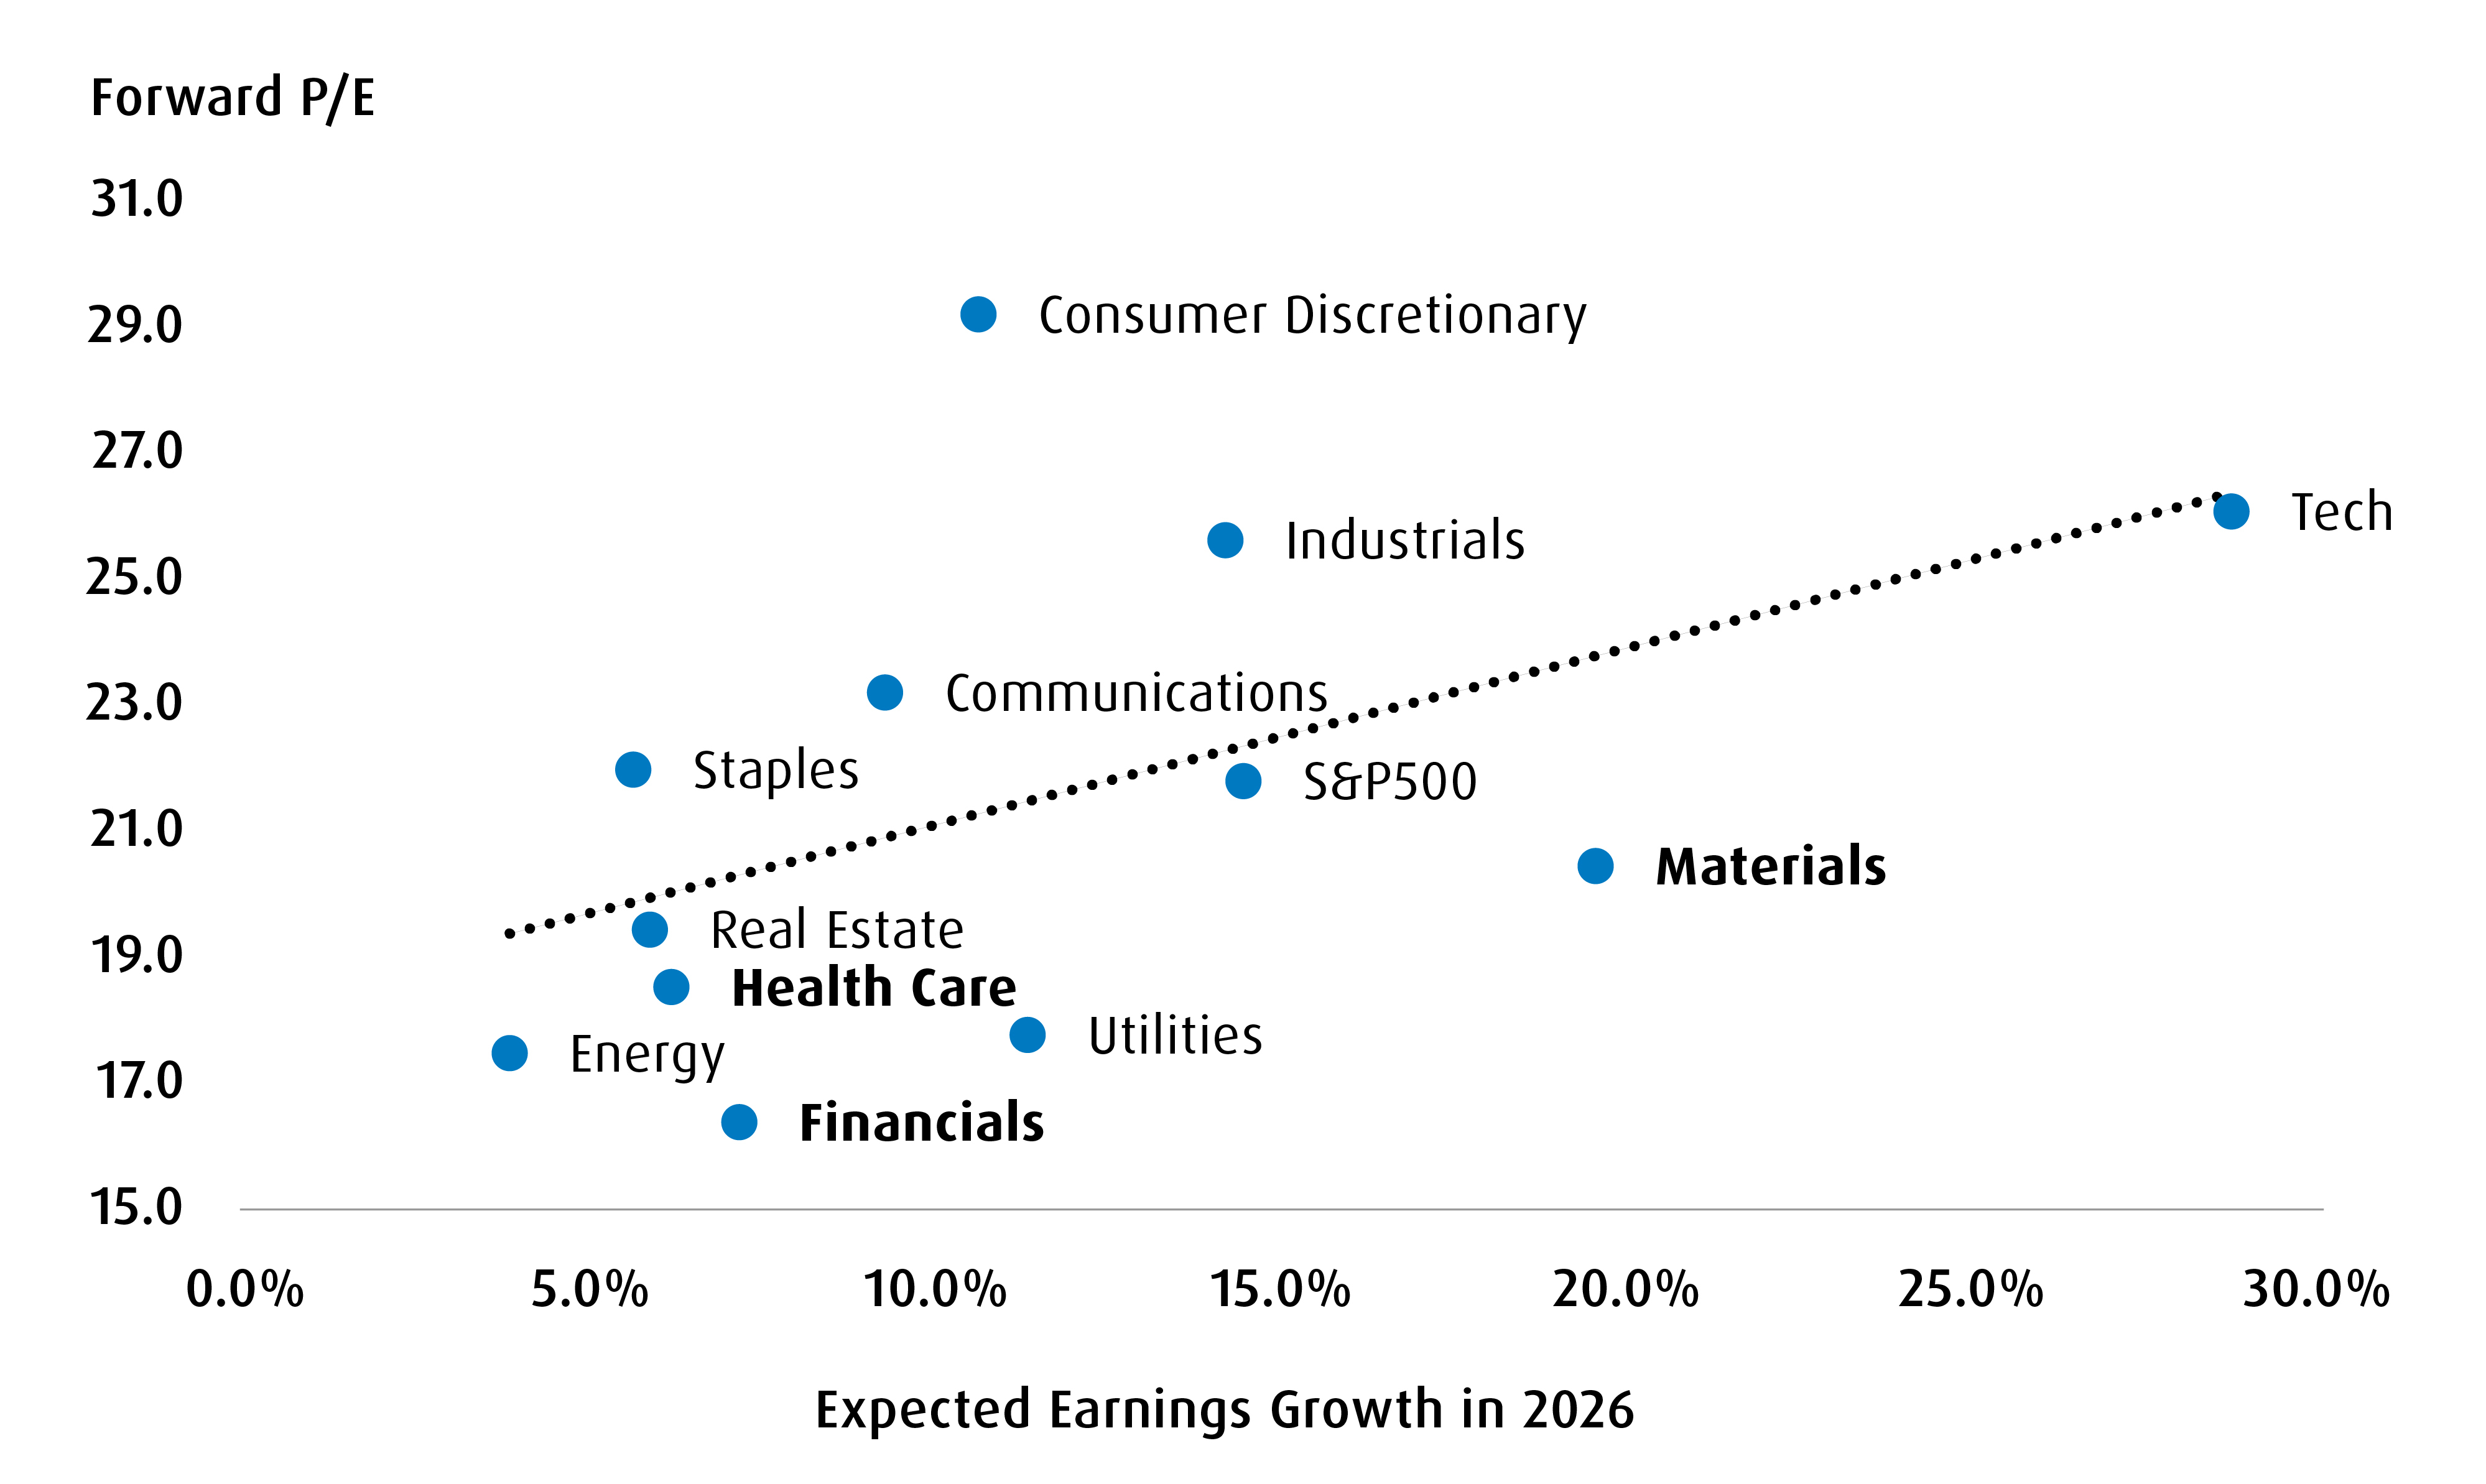
Taking this one last step further, Chart 1 shows a scatter plot of the current forward P/E versus the Street’s estimates for earnings in 2026. This additional screen tells us that Materials is already underpriced. And if the above model is correct, then the scale of undervaluation could increase for that sector (ditto for Financials and Health Care). However, the Consumer Discretionary sector already looks as if it’s overvalued – even with the projected increase in earnings surprise.
To summarize the key takeaways:
- Keep an eye on CPI, the unemployment rate and the ISM composite to get a feel for top-down earnings shifts for the S&P 500 in real time.
- Given the current macro set-up, materials, financials and healthcare feel undervalued.
Chart 1 – Materials, Financials and Health Care Are Undervalued
In terms of allocation decisions, consider the following:
- BMO SPDR Financials Select Sector Index ETF (Ticker: ZXLF)
- BMO SPDR Health Care Select Sector Index ETF (Ticker: ZXLV)
- BMO SPDR Materials Select Sector Index ETF (Ticker: ZXLB)
For more market insights and commentary from BMO ETFs, please visit and bookmark Basis Points.
Ticker |
Year-to-Date |
1-Month |
3-Month |
6-Month |
1-Year |
3-Year |
5-Year |
10-Year |
Since Inception |
Inception Date |
Returns are not available as there is less than one year’s performance data. |
2025-02-04 |
|||||||||
2025-02-04 |
||||||||||
2025-02-04 |
||||||||||
Disclaimers
For advisor use.
This article is for information purposes only. The information contained herein is not, and should not be construed as investment, tax or legal advice to any party. Particular investments and/or trading strategies should be evaluated relative to the individual’s investment objectives and professional advice should be obtained with respect to any circumstance.
Any statement that necessarily depends on future events may be a forward-looking statement. Forward-looking statements are not guarantees of performance. They involve risks, uncertainties and assumptions. Although such statements are based on assumptions that are believed to be reasonable, there can be no assurance that actual results will not differ materially from expectations. Investors are cautioned not to rely unduly on any forward-looking statements. In connection with any forward-looking statements, investors should carefully consider the areas of risk described in the most recent prospectus.
The viewpoints expressed by the author represent their assessment of the markets at the time of publication. Those views are subject to change without notice at any time. The information provided herein does not constitute a solicitation of an offer to buy, or an offer to sell securities nor should the information be relied upon as investment advice. Past performance is no guarantee of future results. This communication is intended for informational purposes only.
The Select Sector SPDR Trust consists of eleven separate investment portfolios (each a “Select Sector SPDR ETF” or an “ETF” and collectively the “Select Sector SPDR ETFs” or the “ETFs”). Each Select Sector SPDR ETF is an “index fund” that invests in a particular sector or group of industries represented by a specified Select Sector Index. The companies included in each Select Sector Index are selected on the basis of general industry classification from a universe of companies defined by the S&P 500®. The investment objective of each ETF is to provide investment results that, before expenses, correspond generally to the price and yield performance of publicly traded equity securities of companies in a particular sector or group of industries, as represented by a specified market sector index.
The Index is a product of S&P Dow Jones Indices LLC or its affiliates (“SPDJI”), and has been licensed for use by the Manager. S&P®, S&P 500®, US 500, The 500, iBoxx®, iTraxx® and CDX® are trademarks of S&P Global, Inc. or its affiliates (“S&P”) and Dow Jones® is a registered trademark of Dow Jones Trademark Holdings LLC (“Dow Jones”), and these trademarks have been licensed for use by SPDJI and sublicensed for certain purposes by the Manager. The ETF is not sponsored, endorsed, sold or promoted by SPDJI, Dow Jones, S&P, their respective affiliates, and none of such parties make any representation regarding the advisability of investing in such product(s) nor do they have any liability for any errors, omissions, or interruptions of the Index.
The S&P 500 Index is an unmanaged index of 500 common stocks that is generally considered representative of the U.S. stock market. The index is heavily weighted toward stocks with large market capitalizations and represents approximately two-thirds of the total market value of all domestic common stocks.
The S&P 500 Index figures do not reflect any fees, expenses or taxes. An investor should consider investment objectives, risks, fees and expenses before investing.
You cannot invest directly in an index.
Commissions, management fees and expenses all may be associated with investments in exchange-traded funds. Please read the ETF Facts or prospectus of the BMO ETFs before investing. Exchange-traded funds are not guaranteed, their values change frequently and past performance may not be repeated.
For a summary of the risks of an investment in the BMO ETFs, please see the specific risks set out in the prospectus. BMO ETFs trade like stocks, fluctuate in market value and may trade at a discount to their net asset value, which may increase the risk of loss. Distributions are not guaranteed and are subject to change and/or elimination.
BMO ETFs are managed by BMO Asset Management Inc., an investment fund manager, a portfolio manager, and a separate legal entity from Bank of Montreal.
BMO Global Asset Management is a brand name under which BMO Asset Management Inc. and BMO Investments Inc. operate.
“BMO (M-bar roundel symbol)” is a registered trademark of Bank of Montreal, used under licence.