Tax Efficient Balanced Strategy Report (Q1 2026)
All prices, returns and portfolio weights are as of market close on December 31, 2025, unless otherwise indicated.


- This is the second quarter for our Tax efficient portfolio.* This portfolio is meant to follow the same fundamental framework as our Balanced Portfolio, though the instruments are adjusted to be more tax efficient for Canadian investors.
- In the fixed income sleeve, the notable change is that we are extending duration for our U.S. exposure. That means that we are switching out of ZUS.U (BMO Ultra Short-Term US Bond ETF – USD Units) and into ZUAG.F (BMO US Aggregate Bond Index ETF – Hedged).
- By making this change, we bring the fixed income sleeve into closer alignment with that of the balanced portfolio (which is more fundamentally driven). Also, while we remain underweight fixed income as an asset class, we do see some potential for duration to perform if the U.S. labour backdrop deteriorates further.
- Table 4 below displays the change in key values for the fixed income sleeve of this portfolio. Note that even with the change, the annualized distribution yield is lower while the weighted average yield to maturity has not shifted all that much. That is exactly what we would like to see to make things more tax efficient.
- In the equity sleeve, we are adjusting the weight of exposure to ZUQ (BMO MSCI USA High Quality Index ETF) and ZCN (BMO S&P/TSX Capped Composite Index ETF) to 27% apiece (from 25% for both). This is a nod towards the desire to maintain diversified exposure to the broader U.S./Canadian markets given the late-stage dynamics.
- Correspondingly, we have reduced the weight of our allocation to ZWT (BMO Covered Call Technology ETF) to 5%. Also, we have switched our exposure from ZWU (BMO Covered Call Utilities ETF) to ZWB (BMO Covered Call Canadian Banks ETF).
- We remain constructive on Canadian banks into 2026 given the scope for additional growth in loan demand (which was not seen in 2025). However, we remain cognizant of the fact that valuations for CAD banks are close to historical levels.
- We are not making any changes to the Alts/Non-traditional hybrid sleeve of our portfolio from the prior quarter.
* Tax Efficient: as compared to an investment that generates an equivalent amount of interest income. For more please see notes on tax characteristics at the bottom of this document.
Table 1 – Holdings for our updated tax efficient portfolio (Q1 2026)
Ticker |
Name |
Weight |
Country |
Fixed income |
|||
10.00% |
Canada |
||
5.00% |
Canada |
||
5.00% |
U.S. |
||
Equities |
|||
27.00% |
U.S. |
||
27.00% |
Canada |
||
5.00% |
U.S. |
||
5.00% |
Canada |
||
Alts/non-traditional hybrids |
|||
6.00% |
U.S. |
||
10.00% |
Canada |
||
Total |
100% |
||
Table 2 – Tax Efficient Portfolio for Q1 2026
Ticker |
ETF name |
Sector positioning |
Price |
Management fee |
Weight (%) |
90-day Volatility |
Volatility contribution |
Annualized distribution yield* |
Weighted average yield to maturity |
Yield/volatility |
|
Fixed income |
|||||||||||
Fixed income |
Core |
$15.12 |
0.09% |
10.0% |
3.91% |
3.66% |
1.98% |
3.31% |
0.51 |
||
Fixed income |
Tactical |
$31.42 |
0.15% |
5.0% |
3.45% |
1.61% |
1.88% |
3.21% |
0.55 |
||
Fixed income |
Core |
$30.03 |
0.08% |
5.0% |
4.53% |
2.12% |
2.71% |
4.32% |
0.60 |
||
Total fixed income |
20.0% |
7.39% |
|||||||||
Equities |
|||||||||||
Equity |
Core |
$97.92 |
0.30% |
27.00% |
11.10% |
28.01% |
0.45% |
0.04 |
|||
Equity |
Core |
$42.72 |
0.05% |
27.00% |
11.57% |
29.21% |
2.24% |
0.19 |
|||
Equity |
Tactical |
$59.65 |
0.65% |
5.00% |
18.27% |
8.54% |
4.91% |
0.27 |
|||
Equity |
Tactical |
$25.21 |
0.65% |
5.00% |
9.46% |
4.42% |
5.67% |
0.60 |
|||
Total equity |
64.0% |
70.17% |
|||||||||
Non-traditional hybrids |
|||||||||||
Hybrid |
Tactical |
$43.79 |
0.65% |
6.00% |
7.67% |
4.30% |
1.23% |
0.16 |
|||
Hybrid |
Tactical |
$36.94 |
0.65% |
10.00% |
19.41% |
18.14% |
5.00% |
0.26 |
|||
Total alternatives |
16.00% |
22.44% |
|||||||||
Total cash |
0.00% |
0.00% |
|||||||||
Portfolio |
0.28% |
100.0% |
10.70% |
100.00% |
2.26% |
0.21 |
Source: BMO Global Asset Management, as of December 31, 2025. Model portfolio for illustrative purposes only. The information contained herein is not, and should not be construed as, investment, tax or legal advice to any party. These are not recommendations to buy or sell any particular security. Particular investments and/or trading strategies should be evaluated relative to the individual’s investment objectives and professional advice should be obtained with respect to any circumstance.
Table 3 – Changes to portfolio from Q4 2025
Sell/trim |
Ticker |
Old weight |
(% change) |
New weight |
Buy/add |
Ticker |
Old weight |
% |
New weight |
5% |
-5% |
0% |
BMO US Aggregate Bond Index ETF (Hedged) |
ZUAG.F |
0% |
5% |
5% |
||
7% |
-2% |
5% |
BMO MSCI USA High Quality Index ETF |
ZUQ |
25% |
2% |
27% |
||
7% |
-7% |
0% |
BMO S&P/TSX Capped Composite Index ETF |
ZCN |
25% |
2% |
27% |
||
BMO Covered Call Canadian Banks ETF |
ZWB |
0% |
5% |
5% |
Chart 1 – Sector exposure
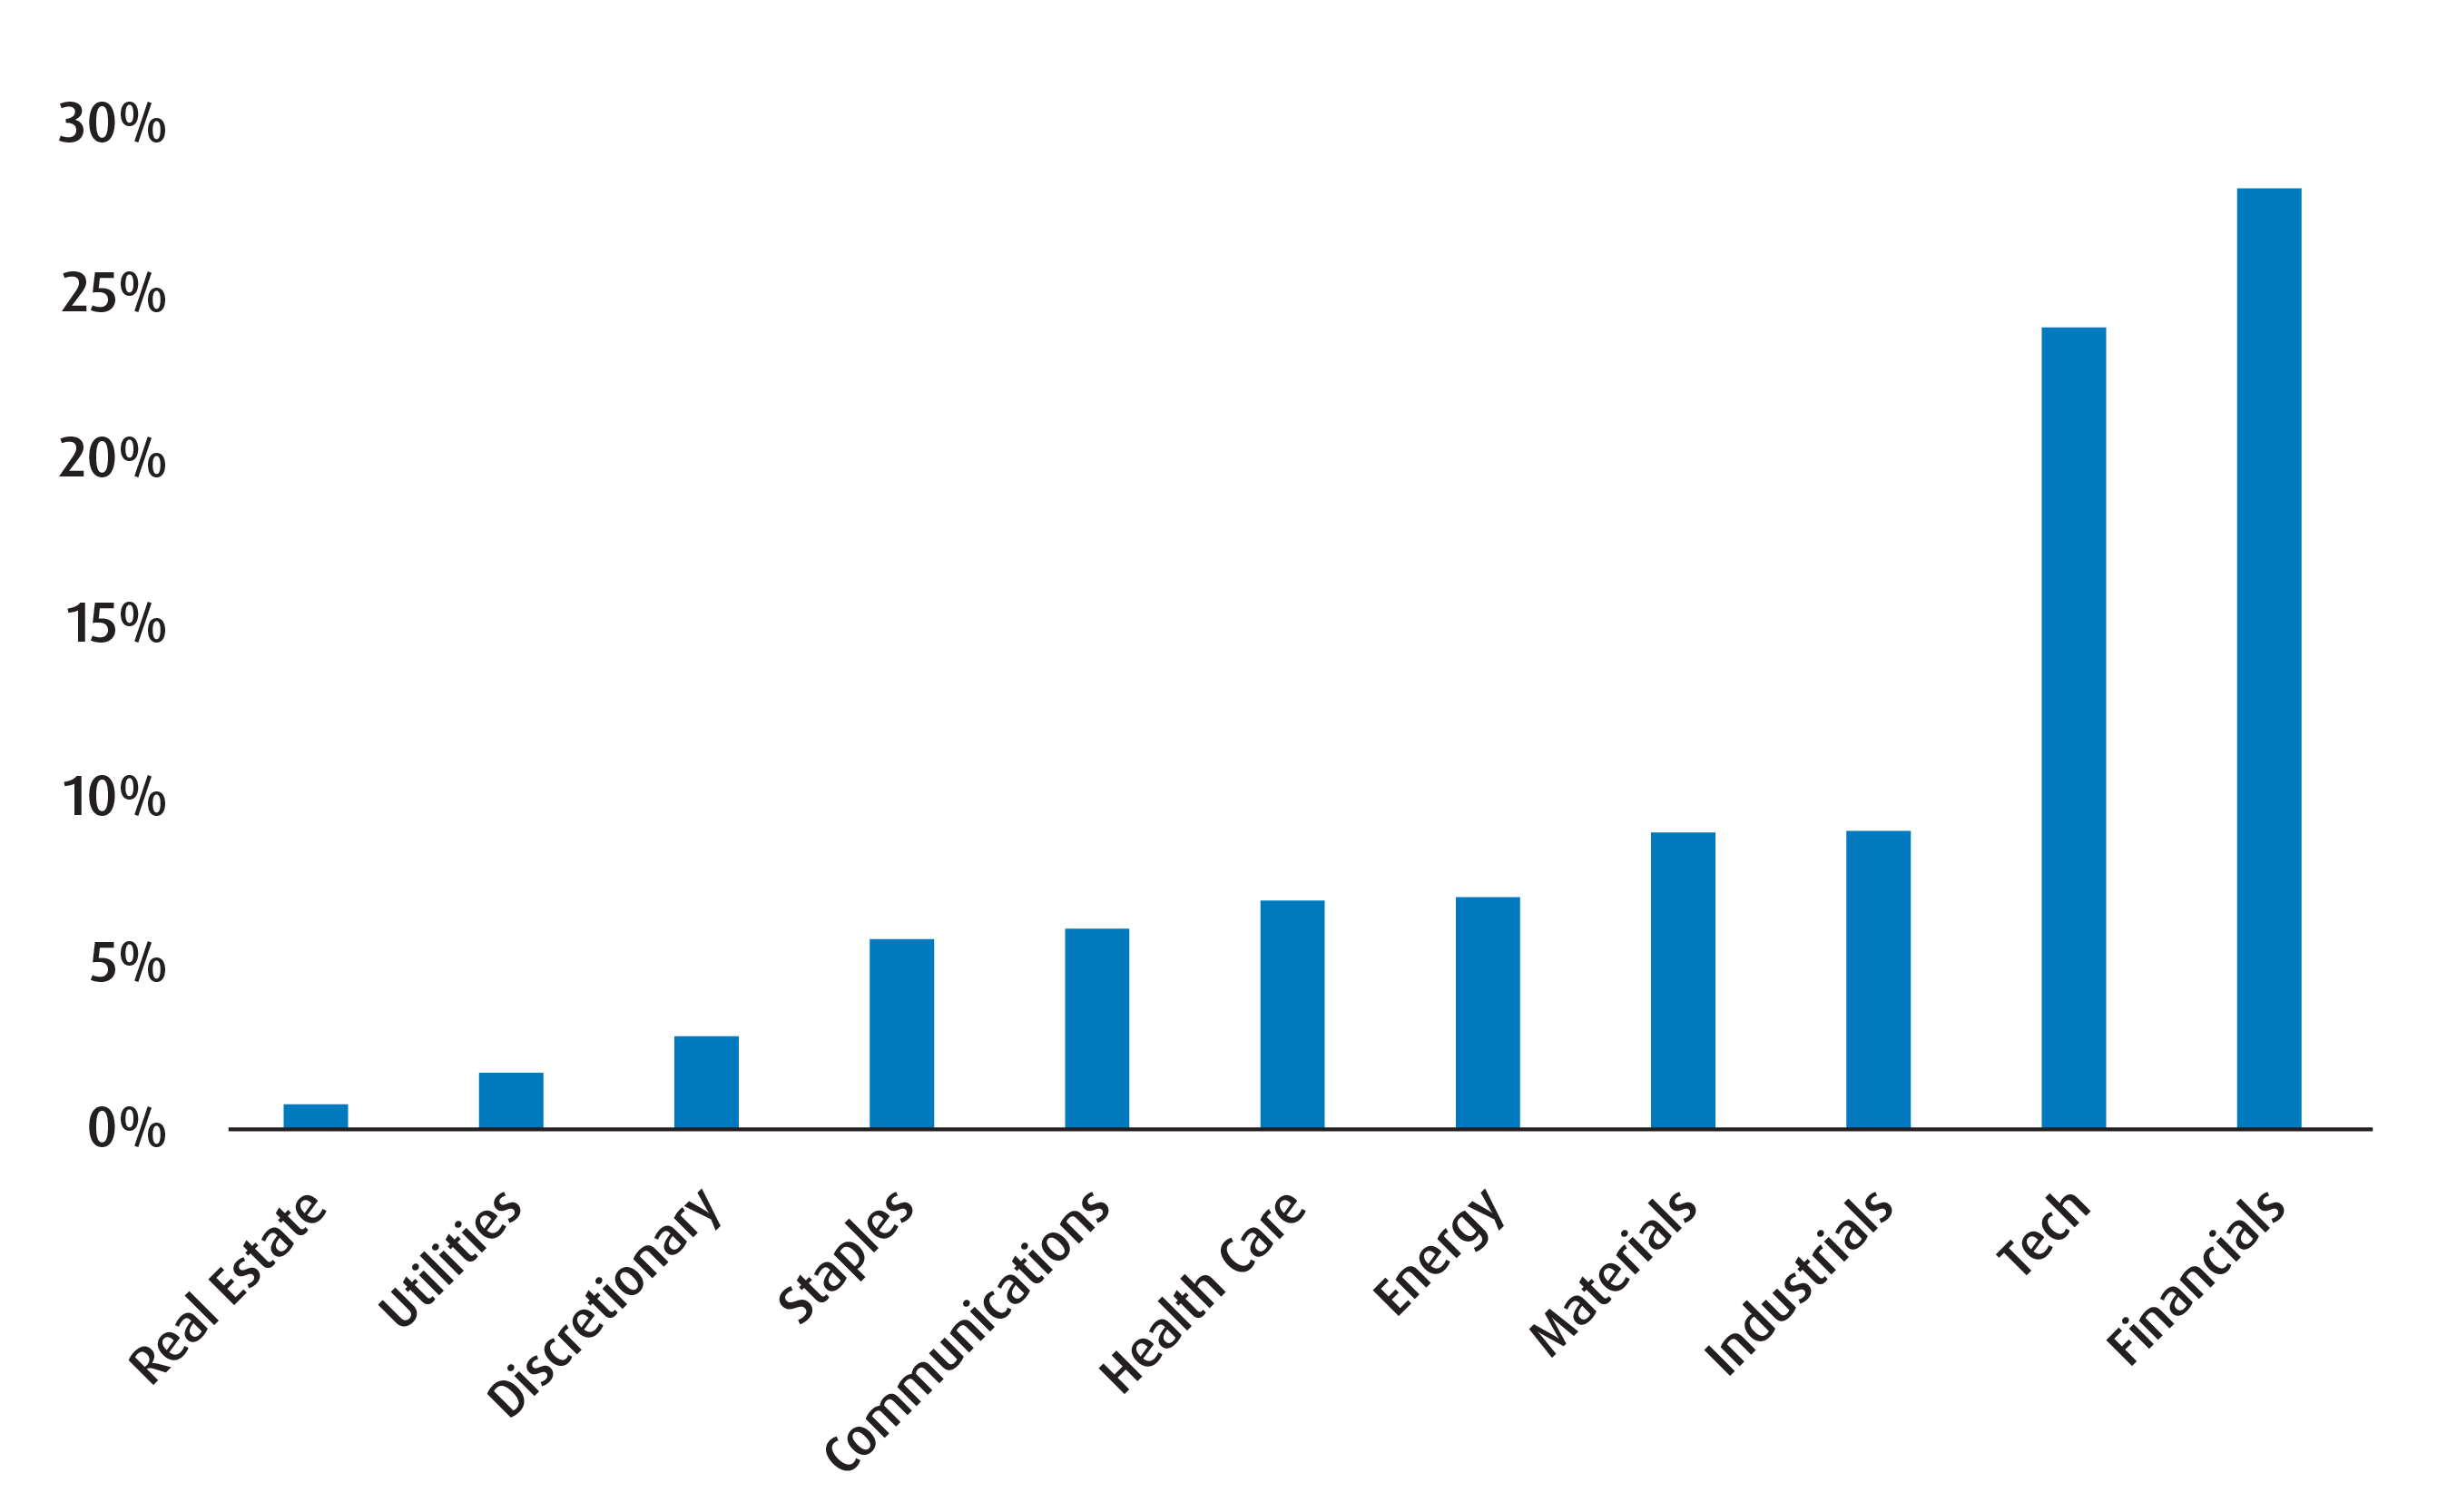
Table 4 – Fixed income exposure breakdown
Q1 2026 |
Q4 2025 |
|
Weighted average term |
7.57 |
5.56 |
Weighted average duration |
5.85 |
4.41 |
Weighted average coupon (%) |
2.17 |
1.97 |
Annualized distribution yield (%) |
2.15 |
2.51 |
Weighted average yield to maturity (%) |
3.54 |
3.51 |
Source: BMO Global Asset Management, as of December 31, 2025. Model portfolio for illustrative purposes only.
Table 5 - Performance of holdings
Ticker |
Year-to-date |
1-month |
3-month |
6-month |
1-year |
3-year |
5-year |
10-year |
Since inception |
Inception date |
ZCN |
31.55% |
1.30% |
6.22% |
19.46% |
31.55% |
21.32% |
16.01% |
12.62% |
9.61% |
2009-05-29 |
ZWB |
34.77% |
4.55% |
11.53% |
24.77% |
34.77% |
19.80% |
14.85% |
11.56% |
10.17% |
2011-01-28 |
ZUAG.F |
5.29% |
-0.40% |
0.49% |
2.07% |
5.29% |
— |
— |
— |
2.29% |
2023-01-23 |
ZUQ |
10.48% |
-1.59% |
2.59% |
11.17% |
10.48% |
25.20% |
15.29% |
15.20% |
16.39% |
2014-11-05 |
ZDB |
2.24% |
-1.37% |
-0.46% |
0.85% |
2.24% |
4.31% |
-0.55% |
1.72% |
2.27% |
2014-02-10 |
ZWT |
18.19% |
-2.16% |
2.38% |
14.48% |
18.19% |
42.77% |
— |
— |
20.32% |
2021-01-20 |
ZLSC |
20.64% |
0.53% |
4.99% |
9.21% |
20.64% |
— |
— |
— |
20.64% |
2023-09-27 |
ZCDB |
4.66% |
-0.39% |
0.20% |
1.97% |
4.66% |
6.27% |
— |
— |
3.33% |
2022-01-24 |
ZWGD |
Returns are not available as there is less than one year’s performance data. |
2025-05-22 |
||||||||
Source: BMO Global Asset Management, as of December 31, 2025.
Notes on tax characteristics:
ZDB, ZCDB, and ZUAG.F
- The BMO Discount Bond ETF suite (ZDB, ZCDB, ZSDB) is designed to minimize interest income by buying bonds with lower coupons that are trading at a discount to par value, such that a portion of future returns will come from price appreciation and will be treated as a capital gain instead of interest income. Please see here for a breakdown of how the suite can help investors reduce taxable interest income relative to traditional bond funds with similar exposures.
- ZUAG.F: Average coupon is far below Yield-To-Maturity (2.82% average coupon, which is lower than the yield to maturity of 4.32% as of December 29, 2025, indicating pull-to-par opportunity and minimization of interest income versus other bond ETFs).
ZUQ
- Dividends from U.S. companies are subject to U.S. withholding tax. Not only do we like the MSCI USA High Quality basket from an investment outlook standpoint, but, because of its screens, it has a lower dividend payout rate, and therefore a lower rate of U.S. withholding tax exposure versus U.S. equity exposures that pay out a higher dividend distribution rate.
ZCN
- As a basket of Canadian companies, the ETF’s distribution is taxed as Canadian eligible dividends and is entitled to the advantageous Canadian dividend gross up and tax credit system.
ZWT
- The basket is composed of U.S. large cap technology names, which pay minimal dividends (foreign income exposed to U.S. withholding tax). The ETF’s covered call strategy sells call options in order to collect monthly cash flow; this portion is taxed as capital gains, which are exposed to tax at a lower rate than interest income or foreign income.
ZWB
- The basket is composed of large cap Canadian banks, which pay dividends. The ETF’s covered call strategy sells call options in order to collect monthly cash flow; this portion is taxed as capital gains, which are exposed to tax at a lower rate than interest income.
ZWU, ZWGD:
These covered call strategies sell call options in order to collect monthly cash flow; this portion of the yield is taxed as capital gains and/or return of capital, which are exposed to tax at a lower rate versus interest income or foreign income.