Portfolio Strategy Report (Q1 2026)
All prices, returns and portfolio weights are as of market close on December 31, 2025, unless otherwise indicated.


How to keep dancing when the party is slowing down
Ever been to a really good party that you didn’t want to end? Remember that feeling you get when the lights start to come back on, the bar is closing and the music is winding down? There’s a slight wistfulness that the fun is over and it’s time to go home – even if you feel like it’s still a bit too early and want to keep dancing.
That’s exactly how a late-cycle market feels, and we can’t help but draw a comparison with where we are today. The fundamentals are solid and investors are still making money – but valuations are high and there’s tension everywhere.
Adding to the late-cycle tone is the outlook for the U.S. economy. Growth is expected to be just slightly below trend in 2026 (which we estimate to be around 2.4-2.5%) but will be driven by continued spending on AI-related investments. The contribution from household spending will be mixed as wealth-driven spending is counterbalanced by a slowing labour market and stickier price pressures.
Speaking of the labour market, the rise in the U.S. unemployment rate is what our readers should be eyeing closely in the months ahead. Its climb over the second half of 2025 tells us that the labour market is struggling to accommodate new entrants. The latest reading for the jobless rate is 4.6% for November 2025 – which is still low relative to prior slowdowns – but its continued rise is the main reason we expect the Federal Reserve (Fed) to ease a few more times in 2026.
In Canada, the going expectation is that the economy should continue to ‘muddle through’ to start the year. Even still, we’re expecting decent years for the financial and materials sectors in Canada. The wildcard? United States – Mexico – Canada Agreement (USMCA) trade negotiations, which should come into sharper focus by Q2. A breakdown could delay planned investments and push unemployment higher — amplifying late-cycle dynamics north of the border.
The key lesson from prior late-cycle regimes is that mistakes matter more when margins for error shrink. While liquidity1 remains ample, we expect that risk profile will turn more selective. Elevated valuation concerns should persist, shaping several themes we’ve highlighted before:
- Greater reliance on earnings to drive U.S. markets in 2026
- Preference for strong balance sheets and stable earnings
- Continued migration toward international markets that remain relatively cheap (see chart 1)
Chart 1 – Several international markets still look cheap relative to the U.S.
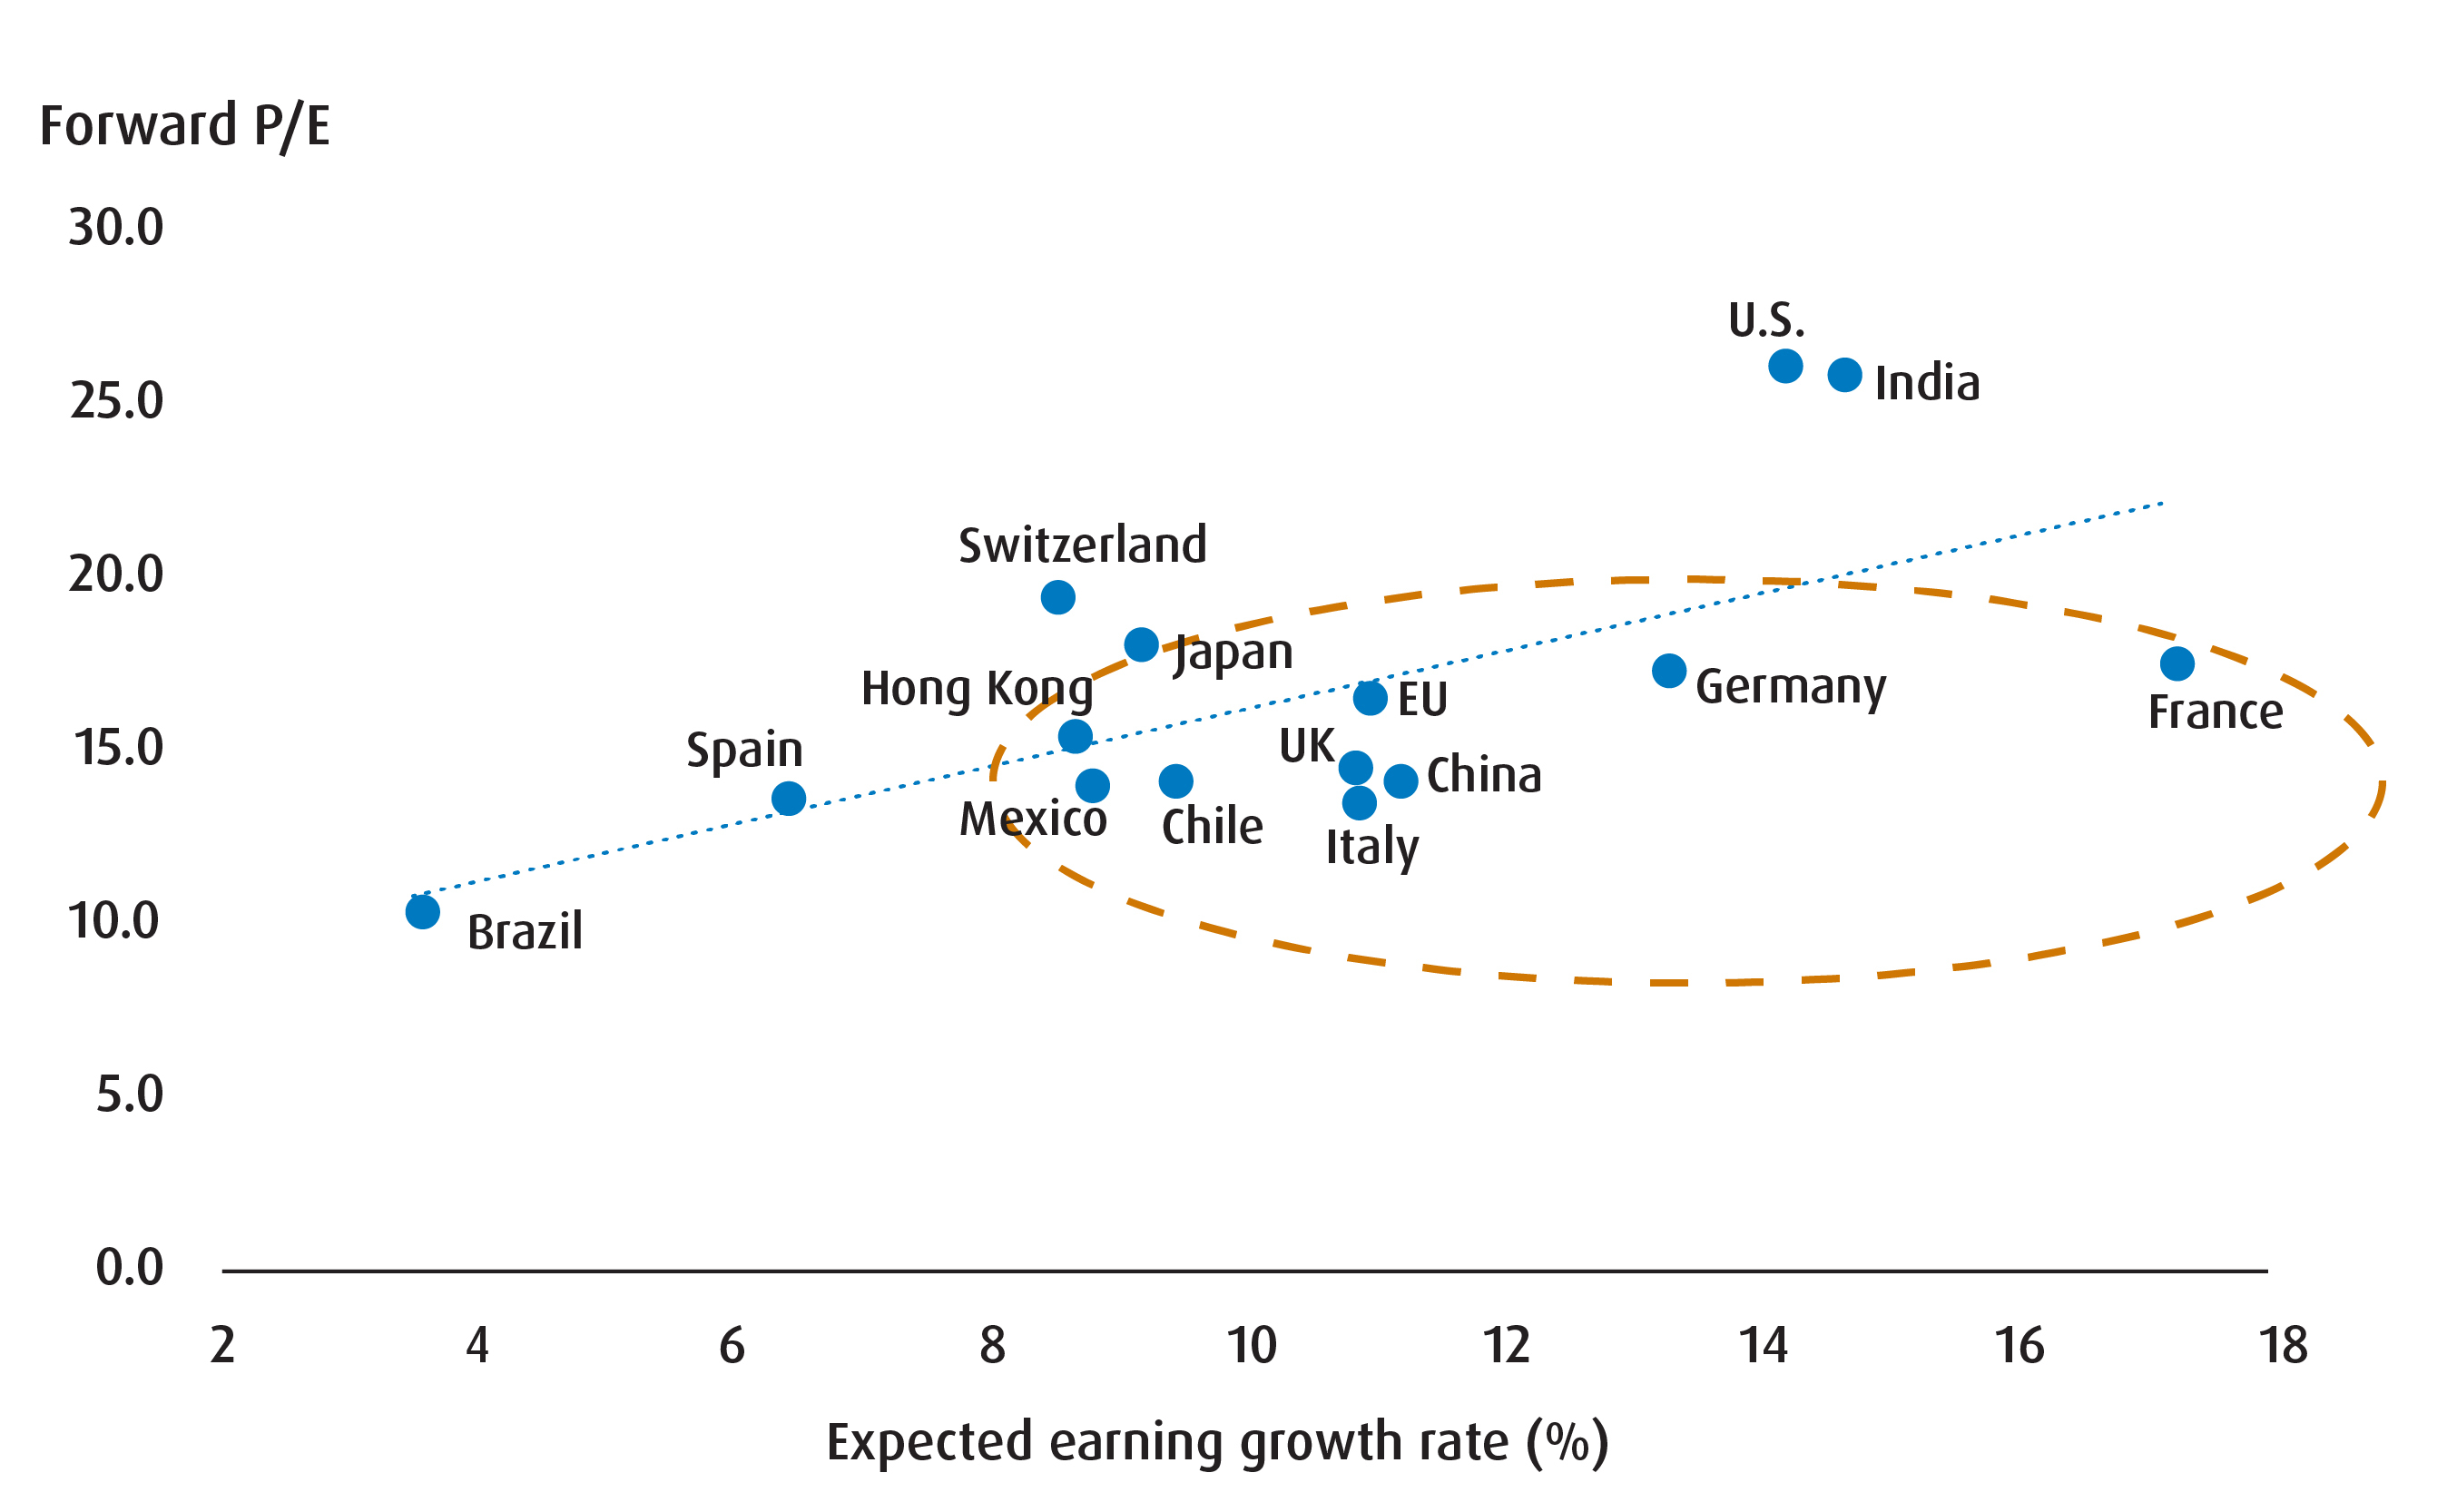
Put simply, the ‘broadening’ of market leadership will remain an investible theme into the start of 2026. We see this as a natural consequence of increased concentration risk over the past few years and the widespread adoption of technology in other sectors and regions. This is precisely why we’re leaning into quality in the U.S. (which contains increased exposure to healthcare relative to the S&P 500), while emphasizing broader exposure in international markets within our balanced portfolio.
In the tactical space, we expect the global push to develop infrastructure should remain a prominent theme. By extension, this will amplify the supply/demand imbalance for a few base metals (copper and aluminum) while still supporting gold.
Importantly, late cycle doesn’t mean an imminent drawdown or a repeat of 2022. It does mean that relying solely on the “Mag 7” (Alphabet, Amazon, Apple, Meta Platforms, Microsoft, Nvidia, Tesla) is insufficient. In our view, we believe investors should seek markets that haven’t fully participated while adding a layer of defensiveness — especially in the U.S.
That’s how you keep dancing, even as the lights start to change.
Table 1 – Balanced portfolio for Q1 2026
Ticker |
ETF name |
Sector positioning |
Price |
Management fee |
Weight (%) |
90-day volatility |
Volatility contribution |
Annualized distribution yield (%)* |
Yield/volatility |
|
Fixed income |
||||||||||
Fixed Income |
Core |
$15.12 |
0.09% |
5.0% |
3.91% |
1.67% |
1.98% |
0.51 |
||
Fixed Income |
Core |
$30.03 |
0.08% |
5.0% |
4.53% |
1.94% |
2.71% |
0.60 |
||
Fixed Income |
Tactical |
$30.69 |
0.25% |
10.0% |
3.11% |
2.66% |
4.13% |
1.33 |
||
Total fixed income |
20.0% |
6.27% |
||||||||
Equities |
||||||||||
Equity |
Core |
$97.92 |
0.30% |
25.00% |
11.10% |
23.74% |
0.45% |
0.04 |
||
Equity |
Core |
$42.72 |
0.05% |
18.00% |
11.57% |
17.83% |
2.23% |
0.19 |
||
Equity |
Core |
$28.17 |
0.20% |
10.00% |
10.42% |
8.91% |
2.13% |
0.20 |
||
Equity |
Tactical |
$26.89 |
0.25% |
6.00% |
13.87% |
7.12% |
2.08% |
0.15 |
||
Equity |
Tactical |
$107.32 |
0.55% |
5.00% |
36.13% |
15.46% |
0.20% |
0.01 |
||
Total equity |
64.0% |
73.06% |
||||||||
Non-traditional hybrids |
||||||||||
Hybrid |
Tactical |
$36.94 |
0.65% |
10.00% |
19.41% |
16.60% |
5.00% |
0.26 |
||
Hybrid |
Tactical |
$20.18 |
1.05% |
2.00% |
8.41% |
1.44% |
2.98% |
0.35 |
||
Hybrid |
Tactical |
$43.79 |
0.65% |
4.00% |
7.67% |
2.63% |
1.23% |
0.16 |
||
Total alternatives |
16.00% |
20.67% |
||||||||
Total cash |
0.00% |
0.00% |
||||||||
Portfolio |
0.29% |
100.0% |
11.69% |
100.0% |
2.12% |
0.18 |
Source: BMO Global Asset Management, as of December 31, 2025. Model portfolio for illustrative purposes only. The information contained herein is not, and should not be construed as, investment, tax or legal advice to any party. These are not recommendations to buy or sell any particular security. Particular investments and/or trading strategies should be evaluated relative to the individual’s investment objectives and professional advice should be obtained with respect to any circumstance.
* The Annualized Distribution Yield is calculated by taking the most recent regular distribution, or expected distribution, (excluding additional year end distributions) annualized for frequency, divided by current NAV. The yield calculation does not include reinvested distributions. Yield calculations for bonds are based on yield to maturity, including coupon payments and any capital gain or loss that the investor will realize by holding the bonds to maturity and. For equities, it is based on the most recent annualized income received divided by the market value of the investments. Please note yields of equities will change from month to month based on market conditions.
Table 2 – Changes to portfolio from Q4 2025
Sell/trim |
Ticker |
Old weight |
(% change) |
New weight |
Buy/add |
Ticker |
Old weight |
% |
New weight |
5% |
-5% |
0% |
0% |
5% |
5% |
||||
12% |
-12% |
0% |
20% |
5% |
25% |
||||
10% |
-4% |
6% |
17% |
1% |
18% |
||||
5% |
-5% |
0% |
0% |
10% |
10% |
||||
2% |
-2% |
0% |
0% |
5% |
5% |
||||
0% |
2% |
2% |
Source: BMO Global Asset Management, as of December 31, 2025. Model portfolio for illustrative purposes only. The information contained herein is not, and should not be construed as, investment, tax or legal advice to any party. These are not recommendations to buy or sell any particular security. Particular investments and/or trading strategies should be evaluated relative to the individual’s investment objectives and professional advice should be obtained with respect to any circumstance.
Asset Allocation
- We elected to keep our asset allocation splits consistent with the Q4 edition of our portfolio. Indeed, we remain slightly overweight equities relative to our benchmark (see table 3 below), underweight fixed income and overweight alts/non-traditional hybrids.
- Despite our view that the current market backdrop can be best characterized as ‘late cycle’, we still feel that an overweight position in equities makes sense. This reflects our conviction that market leadership will continue to broaden from U.S. mega caps to other sectors and regions that are undervalued.
- Our underweight position in fixed income reflects our concern that there is limited scope for both the Bank of Canada (BoC) and Fed to ease rates from here. At the same time, we see risks to duration given term premium spillover from other markets (namely Japan) as well as stickier price pressures in the U.S., which may require a repricing of inflation breakevens.
- We remain overweight alts/non-traditional hybrids as we see this space as a more suitable diversifier for broad equity risk. In particular, we continue to see tailwinds for infrastructure and gold into next year.
Table 3 – Current asset allocation splits relative to benchmark
Current weight |
Benchmark |
||
Fixed income |
20% |
30% |
Underweight |
|
5% |
15% |
|
|
15% |
15% |
|
Equities |
64% |
60% |
Overweight |
|
25% |
25% |
|
|
18% |
25% |
|
|
21% |
10% |
|
Alts/hybrids |
16% |
10% |
Overweight |
Source: BMO Global Asset Management, as of December 31, 2025.
Equities
- In the U.S., we’re increasing our allocation to ZUQ (BMO MSCI USA High Quality Index ETF) as we feel that investors are likely to prioritize strong balance sheets and steady earnings into 2026. Additionally, we like the increased footprint of sectors like healthcare – which remains reasonably valued relative to other sectors.
- For our international allocation, we are broadening our exposure to the EAFE market via ZEA (BMO MSCI EAFE Index ETF) instead of focusing on a particular factor like quality. This reflects our view that international markets have likely decoupled from the U.S. to a degree and that other regions should benefit from a boost in productivity from fiscal spending.
- Additionally, we are making a tactical allocation to ZMT (BMO Equal Weight Global Base Metals Hedged to CAD Index ETF). In our minds, the base metals market should remain strong into the start of 2026 given the balkanized trade environment and the supply/demand imbalance for certain markets like copper and aluminum.
Fixed Income
- The only notable change we’ve made in the fixed income sleeve of our portfolio is that we’ve swapped out ZUCM.U for ZUAG.F (BMO US Aggregate Bond Index ETF – Hedged). This is to pay tribute to the fact that the Fed has re-started its easing cycle..
- We’ve also upgraded this holding to ‘core’ whilst also reclassifying our holding of ZBI (BMO Canadian Bank Income Index ETF) to ‘tactical’. The latter is an acknowledgement that we’re likely to begin curbing our position in the quarters to come.
Alts/Non-Traditional Hybrids
- This sleeve has remained relatively unchanged – though we have switched instruments for our exposure to infrastructure. Indeed, we’ve swapped out of ZGI for ZGIF (BMO Global Infrastructure Fund ETF – Active ETF Series).
- Put simply, we like the more diversified nature of the latter as opposed to the U.S. specific nature of the former. Also, ZGIF focuses on infrastructure areas that we are more constructive on – including electric grids, and engineering/construction projects. The drawback is the change in cost, though that shouldn’t change the overall cost of our portfolio by much.
Chart 2 – Q1 2026 regional exposure
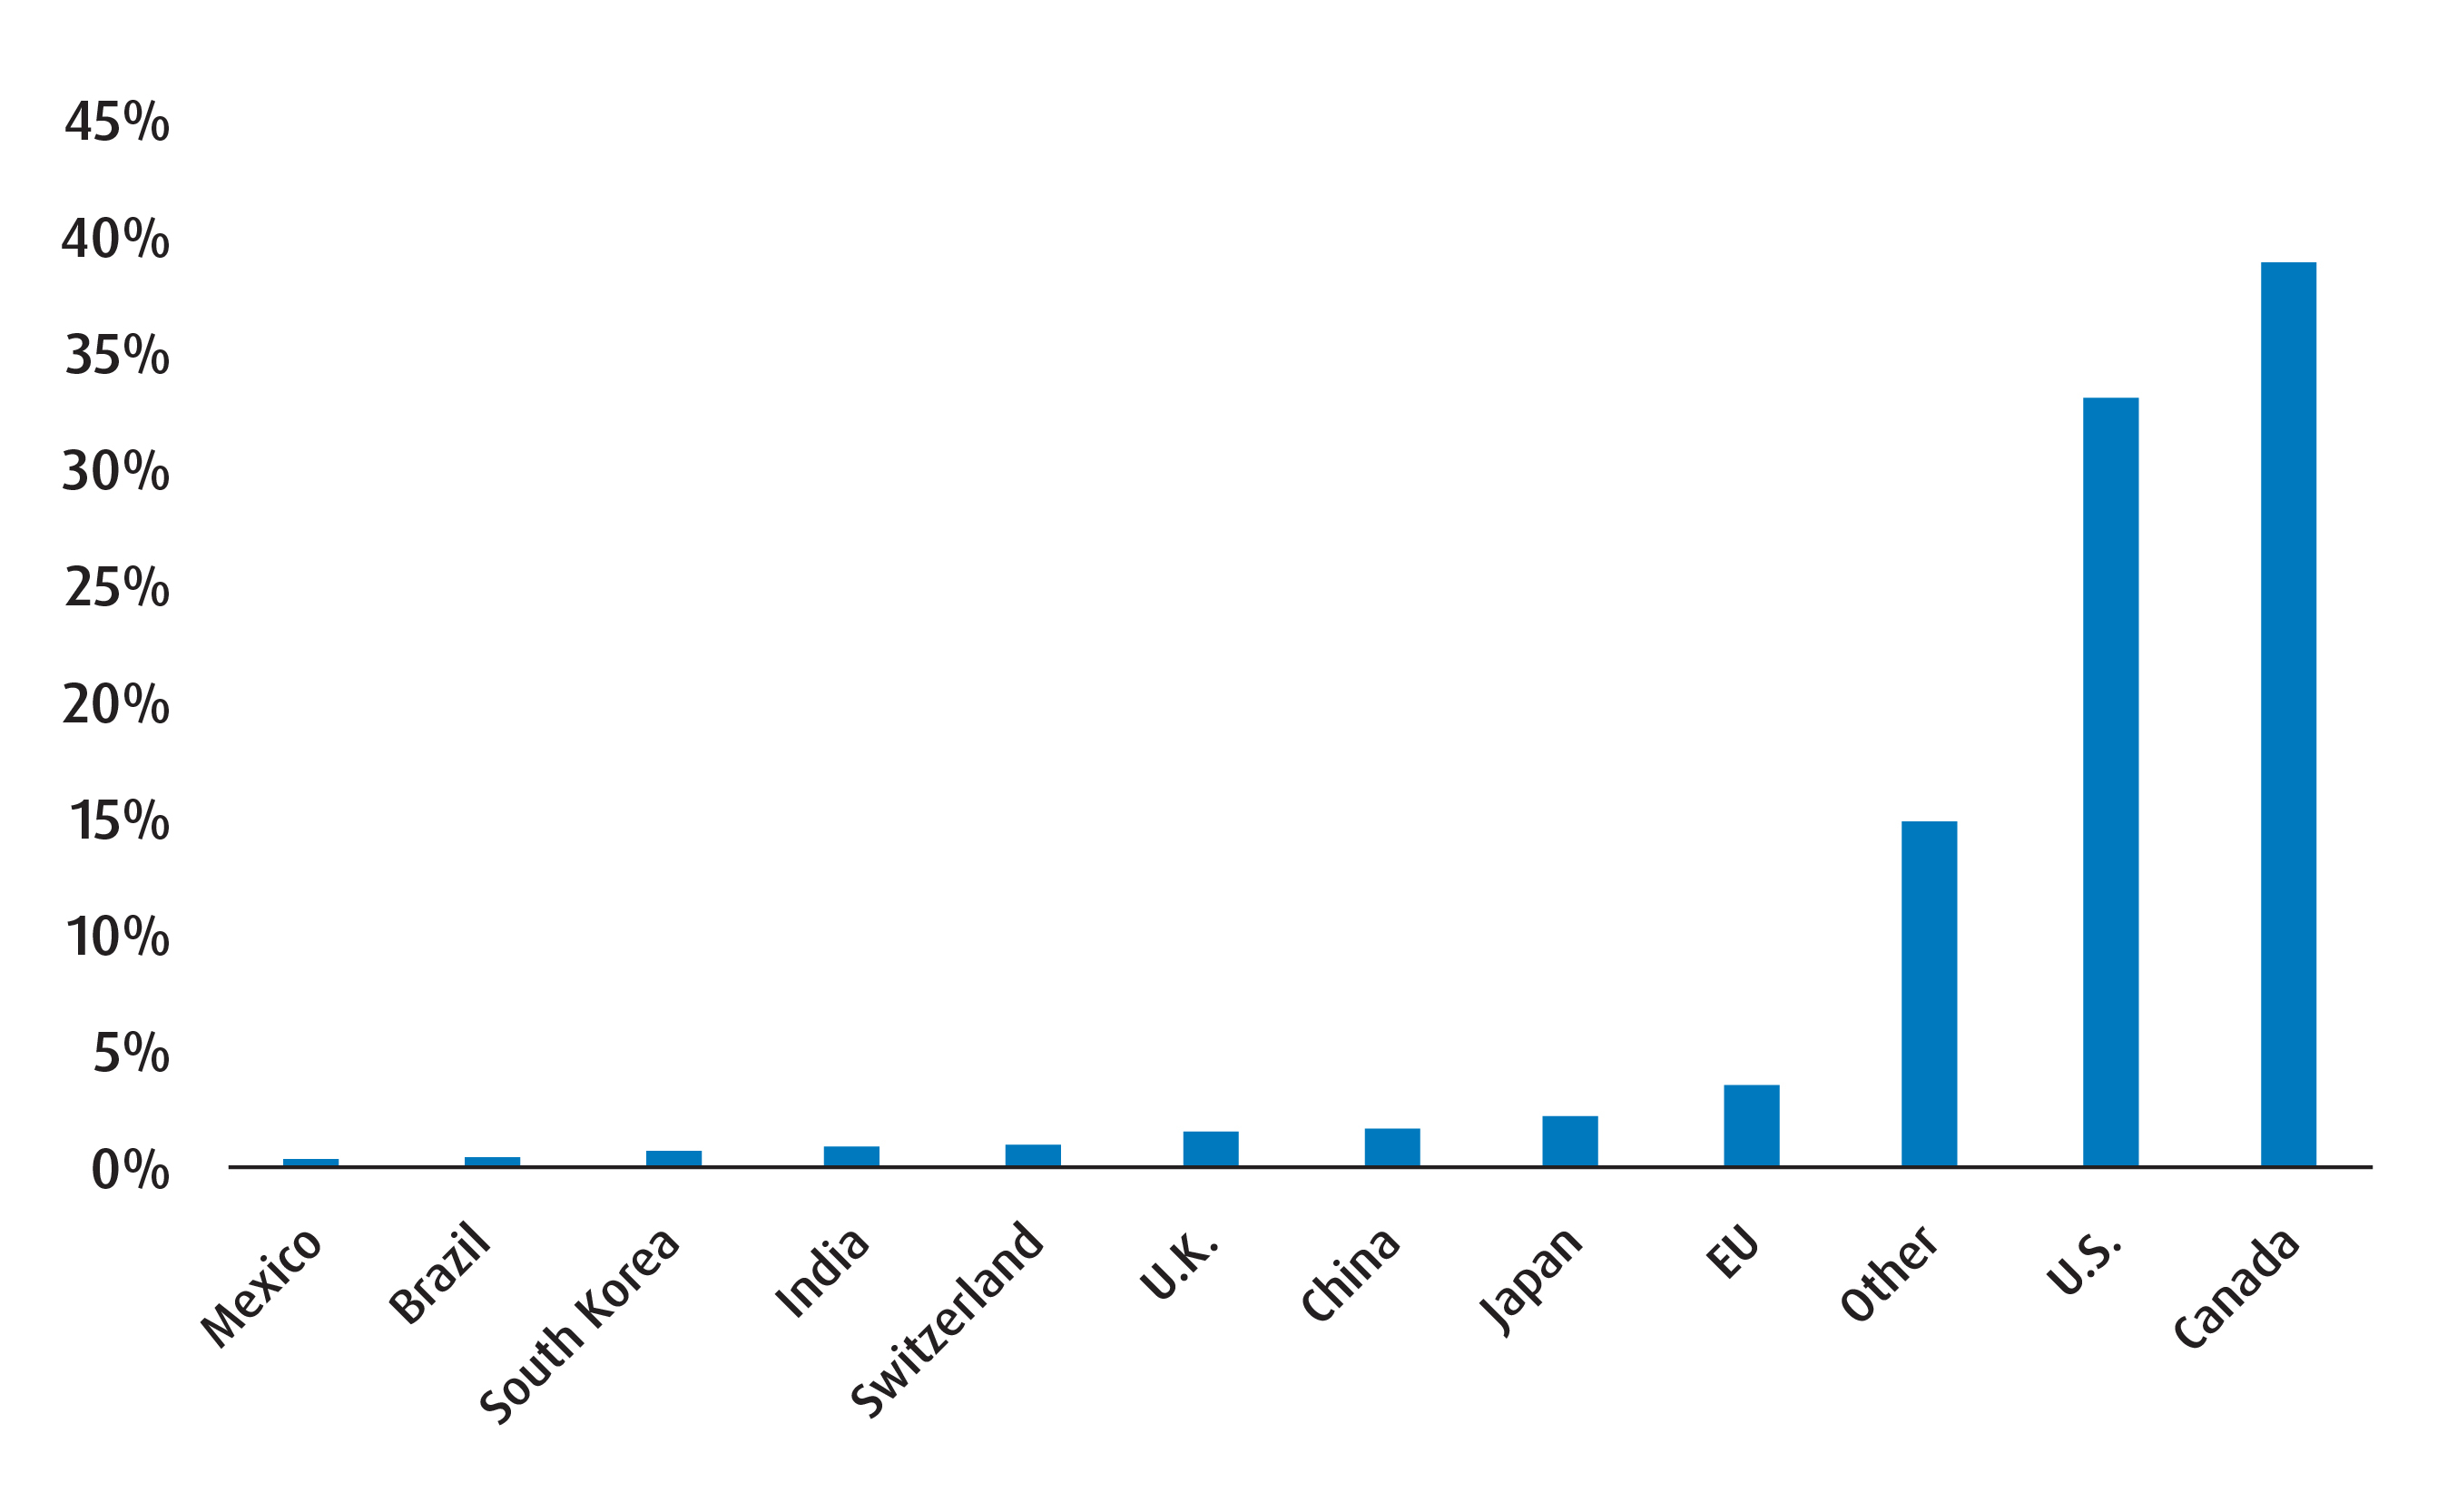
Chart 3 – Global equity sector breakdown
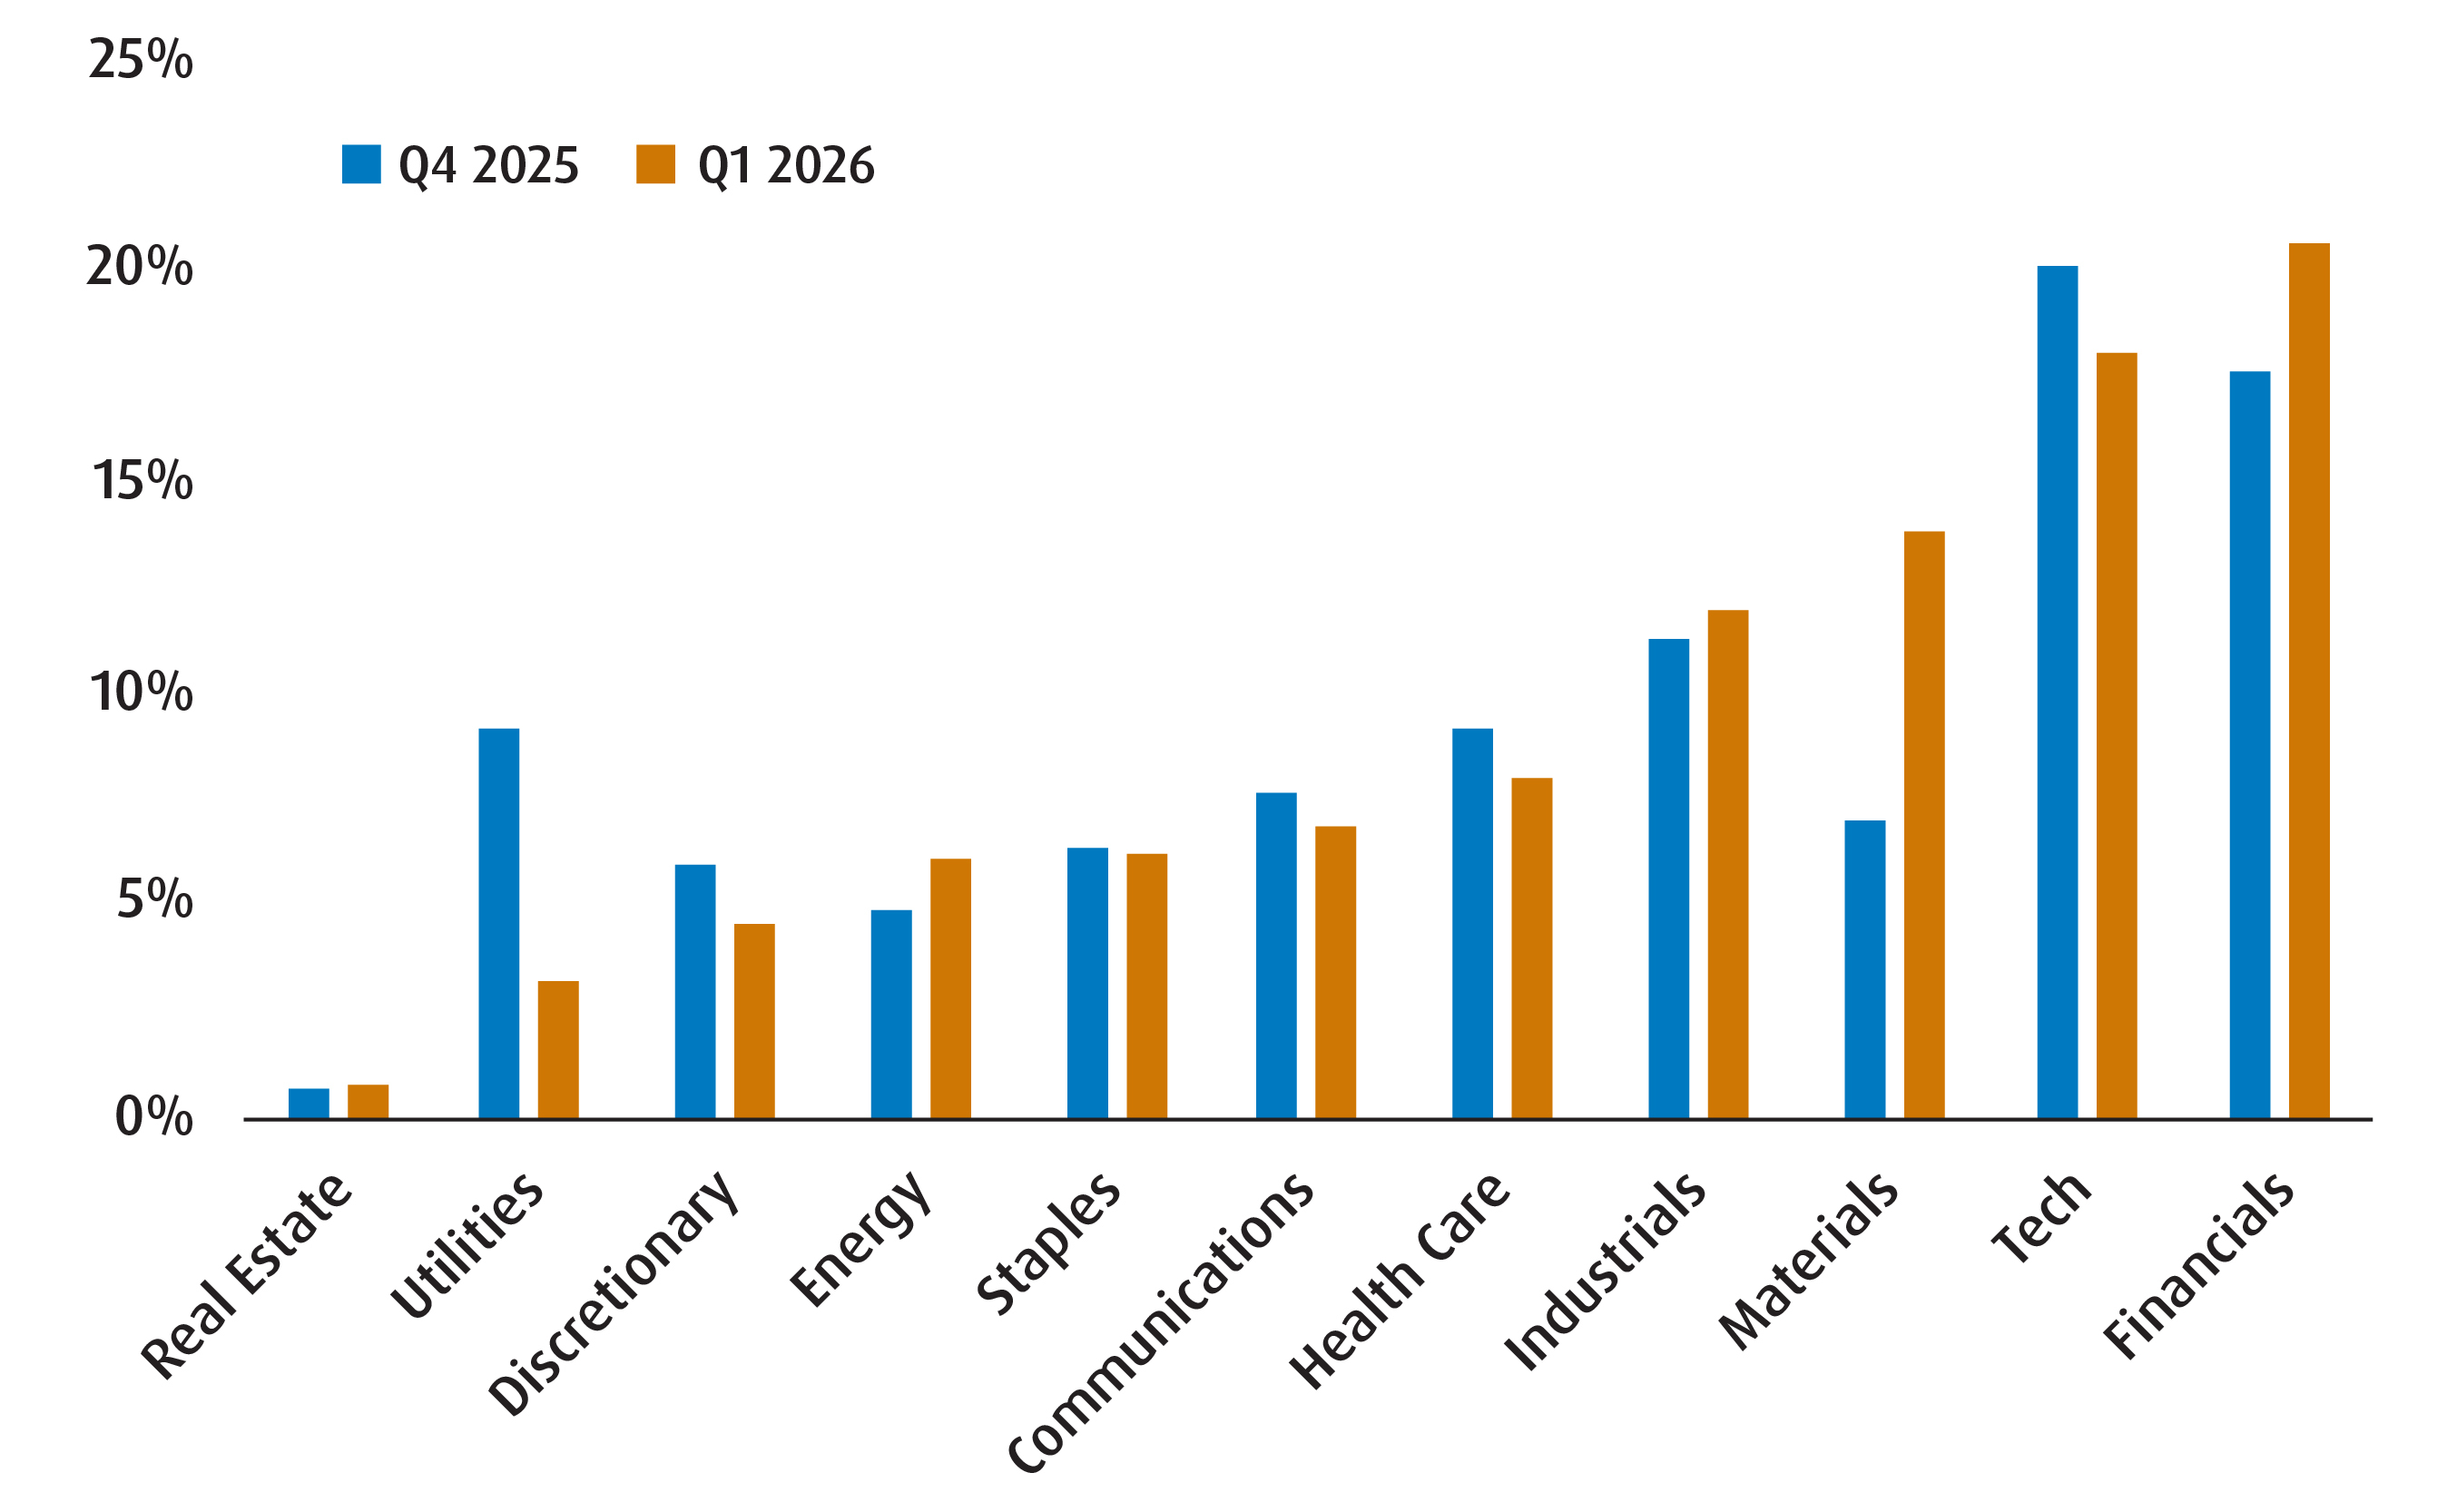
Table 4 – Fixed income breakdown
Q1 2026 |
Q4 2025 |
|
Weighted average term |
5.48 |
3.43 |
Weighted average duration |
4.26 |
2.76 |
Weighted average coupon (%) |
3.53 |
2.77 |
Annualized distribution yield (%) |
3.24 |
2.66 |
Weighted average yield to maturity (%) |
3.78 |
2.59 |
Source: BMO Global Asset Management, as of December 30, 2025. For illustrative purposes only.
Table 5 – Performance of holdings over time
Fund Performance (%) |
1-month |
3-month |
6-month |
1-year |
2-year |
3-year |
5-year |
10-year |
Since inception |
Inception date |
1.30% |
6.22% |
19.46% |
31.55% |
26.45% |
21.32% |
16.01% |
12.62% |
9.61% |
2009-05-29 |
|
0.83% |
2.79% |
9.73% |
25.02% |
18.33% |
17.26% |
10.28% |
8.03% |
8.39% |
2014-02-10 |
|
0.44% |
2.85% |
16.75% |
28.18% |
21.09% |
16.28% |
5.21% |
8.09% |
5.91% |
2009-10-20 |
|
-0.40% |
0.49% |
2.07% |
5.29% |
2.58% |
— |
— |
— |
2.29% |
2023-01-23 |
|
-1.59% |
2.59% |
11.17% |
10.48% |
21.62% |
25.20% |
15.29% |
15.20% |
16.39% |
2014-11-05 |
|
-1.37% |
-0.46% |
0.85% |
2.24% |
3.18% |
4.31% |
-0.55% |
1.72% |
2.27% |
2014-02-10 |
|
0.26% |
0.98% |
3.04% |
5.56% |
8.70% |
8.14% |
— |
— |
4.19% |
2022-02-07 |
|
0.53% |
4.99% |
9.21% |
20.64% |
20.81% |
— |
— |
— |
20.64% |
2023-09-27 |
|
7.67% |
16.24% |
41.40% |
62.57% |
37.28% |
29.69% |
17.50% |
14.83% |
2.89% |
2009-10-20 |
|
Returns are not available as there is less than one year’s performance data. |
2025-05-22 |
|||||||||
-3.23% |
-0.51% |
4.33% |
14.42% |
18.07% |
— |
— |
— |
15.77% |
2023-06-27 |
|
Source: BMO Global Asset Management, as of December 31, 2025. The portfolio holdings are subject to change without notice and only represent a percentage of portfolio holdings. They are not recommendations to buy or sell any particular security.
Q1 2026 BMO ETFs fixed income strategy report
Q1 2026 BMO ETFs tax-efficient strategy report
1 Liquidity: The degree to which an asset or security can be quickly bought or sold in the market without affecting the asset’s price. Cash is considered to be the most liquid asset, while things like fine art or rare books would be relatively illiquid.
Disclaimers
For advisor use only.
The portfolio holdings and asset allocations are subject to change without notice and individual holdings only represent a small percentage of portfolio holdings. They are not recommendations to buy or sell any particular security.
Any statement that necessarily depends on future events may be a forward-looking statement. Forward-looking statements are not guarantees of performance. They involve risks, uncertainties and assumptions. Although such statements are based on assumptions that are believed to be reasonable, there can be no assurance that actual results will not differ materially from expectations. Investors are cautioned not to rely unduly on any forward-looking statements. In connection with any forward-looking statements, investors should carefully consider the areas of risk described in the most recent prospectus.
The viewpoints expressed by the author represents their assessment of the markets at the time of publication. Those views are subject to change without notice at any time. The information provided herein does not constitute a solicitation of an offer to buy, or an offer to sell securities nor should the information be relied upon as investment advice. Past performance is no guarantee of future results.
This communication is for information purposes. The information contained herein is not, and should not be construed as, investment, tax or legal advice to any party. Particular investments and/or trading strategies should be evaluated relative to the individual’s investment objectives and professional advice should be obtained with respect to any circumstance.
Index returns do not reflect transactions costs or the deduction of other fees and expenses and it is not possible to invest directly in an Index. Past performance is not indicative of future results.
The ETFs referred to herein are not sponsored, endorsed, or promoted by MSCI and MSCI bear no liability with respect to an ETF or any index on which such ETF is based. The ETF’s prospectus contains a more detailed description of the limited relationship that MSCI has with the Manager and any related ETF.
The Index is a product of S&P Dow Jones Indices LLC or its affiliates (“SPDJI”), and has been licensed for use by the Manager. S&P®, S&P 500®, US 500, The 500, iBoxx®, iTraxx® and CDX® are trademarks of S&P Global, Inc. or its affiliates (“S&P”) and Dow Jones® is a registered trademark of Dow Jones Trademark Holdings LLC (“Dow Jones”), and these trademarks have been licensed for use by SPDJI and sublicensed for certain purposes by the Manager. The ETF is not sponsored, endorsed, sold or promoted by SPDJI, Dow Jones, S&P, their respective affiliates, and none of such parties make any representation regarding the advisability of investing in such product(s) nor do they have any liability for any errors, omissions, or interruptions of the Index.
The Select Sector SPDR Trust consists of eleven separate investment portfolios (each a “Select Sector SPDR ETF” or an “ETF” and collectively the “Select Sector SPDR ETFs” or the “ETFs”). Each Select Sector SPDR ETF is an “index fund” that invests in a particular sector or group of industries represented by a specified Select Sector Index. The companies included in each Select Sector Index are selected on the basis of general industry classification from a universe of companies defined by the S&P 500®. The investment objective of each ETF is to provide investment results that, before expenses, correspond generally to the price and yield performance of publicly traded equity securities of companies in a particular sector or group of industries, as represented by a specified market sector index.
The S&P 500, SPDRs, and Select Sector SPDRs are trademarks of The McGraw-Hill Companies, Inc. and have been licensed for use. The stocks included in each Select Sector Index were selected by the compilation agent. Their composition and weighting can be expected to differ to that in any similar indexes that are published by S&P. The S&P 500 Index is an unmanaged index of 500 common stocks that is generally considered representative of the U.S. stock market. The index is heavily weighted toward stocks with large market capitalizations and represents approximately two-thirds of the total market value of all domestic common stocks. The S&P 500 Index figures do not reflect any fees, expenses or taxes. An investor should consider investment objectives, risks, fees and expenses before investing.
You cannot invest directly in an index.
Commissions, management fees and expenses all may be associated with investments in exchange-traded funds. Please read the ETF Facts or prospectus of the BMO ETFs before investing. The indicated rates of return are the historical annual compounded total returns including changes in unit value and reinvestment of all dividends or distributions and do not take into account sales, redemption, distribution or optional charges or income taxes payable by any unitholder that would have reduced returns. Exchange-traded funds are not guaranteed, their values change frequently and past performance may not be repeated.
For a summary of the risks of an investment in the BMO ETFs, please see the specific risks set out in the BMO ETF’s prospectus. BMO ETFs trade like stocks, fluctuate in market value and may trade at a discount to their net asset value, which may increase the risk of loss. Distributions are not guaranteed and are subject to change and/or elimination.
Distribution yields are calculated by using the most recent regular distribution, or expected distribution, (which may be based on income, dividends, return of capital, and option premiums, as applicable) and excluding additional year end distributions, and special reinvested distributions annualized for frequency, divided by current net asset value (NAV). The yield calculation does not include reinvested distributions. Distributions are not guaranteed, may fluctuate and are subject to change and/or elimination. Distribution rates may change without notice (up or down) depending on market conditions and NAV fluctuations. The payment of distributions should not be confused with the BMO ETF’s performance, rate of return or yield. If distributions paid by a BMO ETF are greater than the performance of the investment fund, your original investment will shrink. Distributions paid as a result of capital gains realized by a BMO ETF, and income and dividends earned by a BMO ETF, are taxable in your hands in the year they are paid. Your adjusted cost base will be reduced by the amount of any returns of capital. If your adjusted cost base goes below zero, you will have to pay capital gains tax on the amount below zero.
Cash distributions, if any, on units of a BMO ETF (other than accumulating units or units subject to a distribution reinvestment plan) are expected to be paid primarily out of dividends or distributions, and other income or gains, received by the BMO ETF less the expenses of the BMO ETF, but may also consist of non-taxable amounts including returns of capital, which may be paid in the manager’s sole discretion. To the extent that the expenses of a BMO ETF exceed the income generated by such BMO ETF in any given month, quarter, or year, as the case may be, it is not expected that a monthly, quarterly, or annual distribution will be paid. Distributions, if any, in respect of the accumulating units of BMO Short Corporate Bond Index ETF, BMO Short Federal Bond Index ETF, BMO Short Provincial Bond Index ETF, BMO Ultra Short-Term Bond ETF and BMO Ultra Short-Term US Bond ETF will be automatically reinvested in additional accumulating units of the applicable BMO ETF. Following each distribution, the number of accumulating units of the applicable BMO ETF will be immediately consolidated so that the number of outstanding accumulating units of the applicable BMO ETF will be the same as the number of outstanding accumulating units before the distribution. Non-resident unitholders may have the number of securities reduced due to withholding tax. Certain BMO ETFs have adopted a distribution reinvestment plan, which provides that a unitholder may elect to automatically reinvest all cash distributions paid on units held by that unitholder in additional units of the applicable BMO ETF in accordance with the terms of the distribution reinvestment plan. For further information, see the distribution policy in the BMO ETFs’ prospectus.
BMO ETFs are managed and administered by BMO Asset Management Inc., an investment fund manager and a portfolio manager, and a separate legal entity from Bank of Montreal.
BMO Global Asset Management is a brand name under which BMO Asset Management Inc. and BMO Investments Inc. operate.
“BMO (M-bar roundel symbol)” is a registered trademark of Bank of Montreal, used under licence.